URBANmedias
75.1K views | +0 today
Follow
URBANmedias
le mediation des aménagements urbains
Your new post is loading...
Rescooped by association concert urbain from visual data
Scoop.it!

A VISUAL History of Satellites

A VISUAL History of Satellites | URBANmedias | Scoop.it
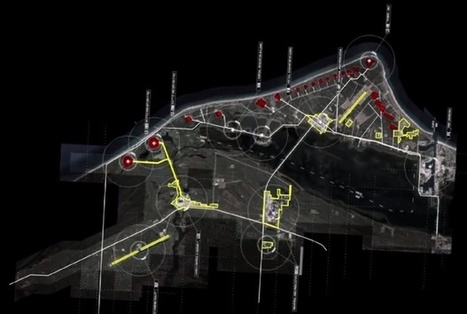
The 'extended urbanization' of space.


Right now, there are about 1,100 satellites whizzing above our heads performing various functions like observation, communication, and spying. There are roughly another 2,600 doing nothing, as they died or were turned off a long time ago.

How did each of these satellites get up there? And what nations are responsible for sending up the bulk of them?

The answers come in the form of this bewitching visualization of satellite launches from 1957 – the year Russia debuted Sputnik 1 – to the present day. (The animation starts at 2:10; be sure to watch in HD.) Launch sites pop up as yellow circles as the years roll by, sending rockets, represented as individual lines, flying into space with one or more satellites aboard.

More information at the link.


Via Lauren Moss
Patrice Mitrano's curator insight, May 27, 2014 8:07 AM

Frise chronologique très impressionnante et détaillée (par type d'orbite de satellites) !

paul babicki's curator insight, July 25, 2014 7:21 PM

An incredible graph!

http://netiquetteiq.blogspot.com

Rescooped by association concert urbain from green streets
Scoop.it!

An iPad Guide To Building The Perfect Sustainable City

An iPad Guide To Building The Perfect Sustainable City | URBANmedias | Scoop.it


In 2010, Harvard’s Graduate School of Design published Ecological Urbanism, a book of interdisciplinary essays on sustainable city-building. But the project had one inescapable shortcoming: When you’re dealing with a field that’s evolving so rapidly, a finite, physical book is liable to be outdated by the time it leaves the printer.

So upon completing the collection, the school commissioned Portland-based interactive studio Second Story to transform the book into an iPad app, a resource that would draw from the original text but could also be updated with new projects and papers as needed. Now available for free, the app shows how dynamic areas of study can benefit greatly from equally dynamic texts.

Features like interactive graphs are innovative ways to access data, as well as useful tools for understanding it. "While working on the app, we found that the data visualizations revealed patterns that told another meta-story that already existed in the book," he says. "Essentially, the patterns illustrated trends in sustainable design, which is attractive for both scholars and the general reader to see."


Visit the link to learn more about how this new format has given research and urban issues a stronger, more engaging and current platform with which users to engage...


Via Lauren Moss
No comment yet.
Rescooped by association concert urbain from visual data
Scoop.it!

Are Our Transit Maps Tricking Us?

Are Our Transit Maps Tricking Us? | URBANmedias | Scoop.it
Subway maps distort the reality on the ground for all kinds of reasons. What happens when we make decisions based on them?

London’s city center takes up about two percent of the city. On the Tube map, it looks four times as big.

Over in New York City, Central Park—which is a skinny sliver, much longer than it is wide—was depicted in some 1960s and ‘70s IRT maps as a fat rectangle on its side.

So public transit maps are distorted, quite on purpose. All of them enlarge city centers. Many use a fixed distance between stations out in the boonies, even if, in reality, they’re spaced wildly differently. Curvy lines are made straight. Transfers are coded with dots, lines, and everything in between.

According to Zhan Guo, an assistant professor of urban planning and transportation policy at NYU Wagner, certain cities allow for more flight of fancy than others. San Francisco and New York have a lot of geographic markers, so passengers will only accept so much map distortion.

New York’s grid system further discourages excessive futzing. In Chicago, the line is elevated, which leaves even less leeway. But in a place like London, with twisty streets, few geographical markers other than the Thames, and an underground system, you can pull a lot more over on people...


Via Lauren Moss
No comment yet.
Rescooped by association concert urbain from visual data
Scoop.it!

These Interactive Maps COMPARE 19th Century American Cities to Today

These Interactive Maps COMPARE 19th Century American Cities to Today | URBANmedias | Scoop.it

The Smithsonian magazine recently dipped into David Rumsey's collection of over 150,000 maps to find some of the best representations of American cities over the past couple hundred years. With some simple programming, they were able to overlay images of vintage maps of some major cities onto satellite images from today. The results are fascinating.


Via Lauren Moss
Gordon Shupe's curator insight, September 3, 2013 8:24 AM

I love interactive maps, and history is fascinating... let's take a look!

Sue Bedard's curator insight, September 5, 2013 8:09 AM

Great for comparrison and reasoning

Rescooped by association concert urbain from visual data
Scoop.it!

Why Infographics Are Visual Thinking

Why Infographics Are Visual Thinking | URBANmedias | Scoop.it

Beth Kanter

http://www.bethkanter.org


Another way to articulate the importance of sense-making.


Think about it this way: Tools are not always actual objects designed to help us with physical activities. A notebook, whether it is a Moleskine or an Evernote digital document, is a tool that expands our memory. A digital calculator, whether it is an inexpensive machine bought in the nearest Dollar Tree or an app downloaded to your iPhone, frees you from the burden of having to retain and execute many complex mathematical algorithms. Non-physical tools (or sets of tools and practices), such as statistics and the scientific method, evolved to let us gaze beyond what we would normally see, and to overcome our deepest biases and lazy habits of mind. The same is true for great visual displays of information...


Via Lauren Moss
No comment yet.