


 Your new post is loading...

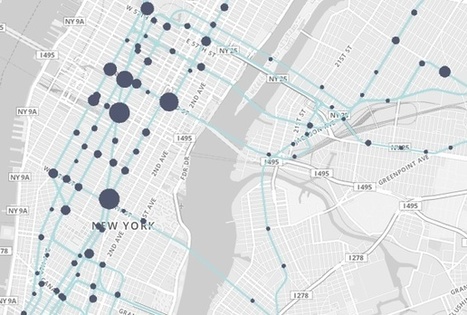

What do 1.6 billion mass transit trips through the city look like?
In 2011, MetroCards were swiped through the turnstiles of the New York City subway system 1.6 billion times. Each swipe was, itself, a data point, and it came connected to myriad others about the day of the week, the subway stop, the identity of the rider. Did the commuter have a student MetroCard, or a senior citizen one? What about a seven-day pass, or a 30-day one?
As a sheer byproduct of moving so many people around the city, the New York Metropolitan Transit Authority constantly churns out information like this. And, thanks to the rapidly expanding movement for open data, it’s now available to the public – if we can just begin to figure out what to do with it.
"This is such a big sprawling thing," says John Geraci, who heads the New York office of faberNovel, a Paris-based company that consults with cities, non-profits and private companies on how to act more like startups. "This data was not created really with this in mind, with the idea of being seen by people. It’s like data exhaust."
Geraci’s firm has just created a data visualization site playing with all of this information to at least begin to tempt our imaginations on what we could learn from it...
Via Lauren Moss, Sylvia Fredriksson


