Your new post is loading...
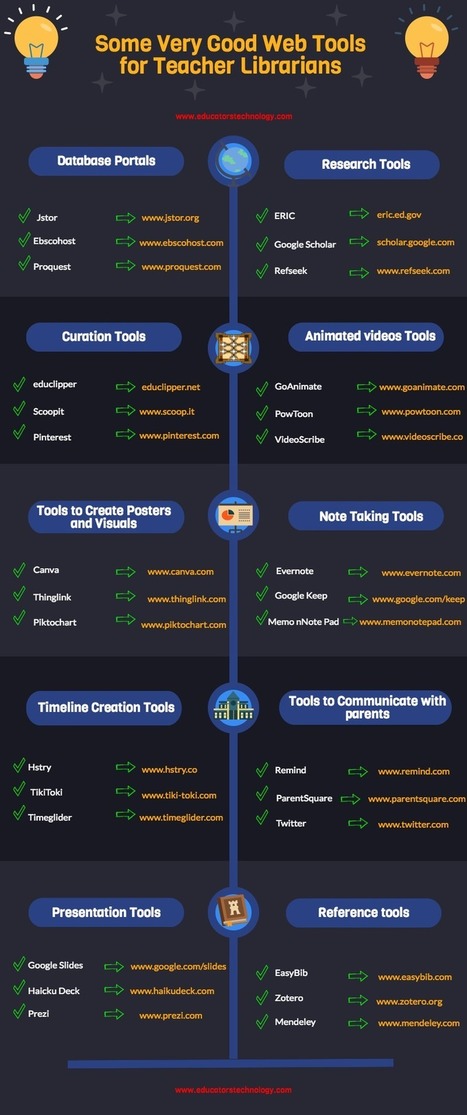
Below are two handy visuals we published awhile ago featuring what we think are some of the best educational web tools and iPad apps curated specifically for librarians. The web tools are organized into the following categories: Database portals, research tools, curation tools, animated video tools, poster creation tools, note taking tools, timeline creation tools, tools communicate with parents, presentation tools and reference tools.
Via John Evans
Here are 101 fantastic social media technology tool tips that you can use to promote your business on social media. Are you looking for some tools and tips related to social media tools and technology? Want to add a bit of magic to your social media marketing? As we specialise in tools and technology we come across great tips and tools every day. From the list below we guarantee you will find something very useful for your business.
Via Martin Gysler

|
Rescooped by
pa3geo
from visual data
|
No matter what happens, there will always be a demand for data visualization tools. Data on its own can be pretty boring and brightening it up with images and other visual tools, it can make normally inaccessible information much easier to digest. (Editor’s Note: It’s also great for information reading literacy, and the new Common Core demand for multimedia “texts.”)
There are a number of fantastic tools out there that will present your data in an accessible manner. All of the tools listed below are free and chances are you’ve used one or two of the tools mentioned before.
Via Lauren Moss
"What I want to do in this post is to introduce you to some successful educational wikis created and run by educators like you and me . This list of wiki is a must see by every teacher and it would be better if you bookmark it for later reference."
Via Dr. Susan Bainbridge, Elena Elliniadou
|
|
Rescooped by
pa3geo
from visual data
|
We have a list of 10 Best Tools for Creating Infographics. Making infographics from scratch can be a tough as and not all the people can do it. This is where some tools can help — numerous resources are available to help you while designing and creating infographics. Graphics and visualization samples from each website are included in this list, so you can visit each link and see the infographics directly from the source. Check out this list of 10 Best Tools for Creating Infographics, and find the ones that suit your needs the best...
Via Lauren Moss
There are hundreds of places to find educational games and quizzes on the Internet. That said, sometimes you still cannot find quite what you're looking for. In those cases you're better off creating your own games. Here are seven good tools you and your students can use for creating games.
Via Donna Browne, WebTeachers, michel verstrepen, Informatics
|
|
Rescooped by
pa3geo
from visual data
|
I love a good infographic! After all, knowledge is power and the visualization of data makes absorbing information all the easier. Well-designed infographics have a way of pulling me into a subject I'd normally never care to know about. As a designer I can attest to the crazy amount of time it takes to make a compelling, useful infographic. I have to say I knew about many of the great links, resources and tools I’ve linked to here on this post before but I dug deep and found some new and exciting infographic tools that I’m willing to bet you haven’t seen before. Items 1-5 under the Data Visualization Tools and Software category are sufficiently capable of arming even a novice designer with the ability to produce a powerful infographic (though I’m sure experts will find them handy as well). In short, if you love infographics, data visualization and information design as much as I do, you’re going to love this post...
Via Lauren Moss
|
|
Rescooped by
pa3geo
from visual data
|
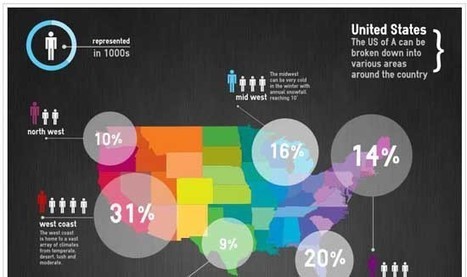
Art, maps,imagery and graphs add context and a visual component to numbers, locations, and information. With as much influx of data we contend with on a daily basis, visualization tools allows our brains to take a rest while perceiving content in a different light. In essence, visualization allows us to stop and smell the pixels, in spite of the fact we might learn a few things along the way. Visualization is a technique to graphically represent sets of data that makes it easier to read and understand. Tools for visualization exist in search, social networks, online communities, mobile apps and desktop applications. Check out of some of the most unique visualization tools available today...
Via Lauren Moss
Themeefy is a cool new way to discover, curate, compile and publish knowledge from the web to create your personal Theme magazine.
Via Kathleen Cercone, 2nd-Library
|
|
|
Rescooped by
pa3geo
from Best
|
|
|
Rescooped by
pa3geo
from visual data
|
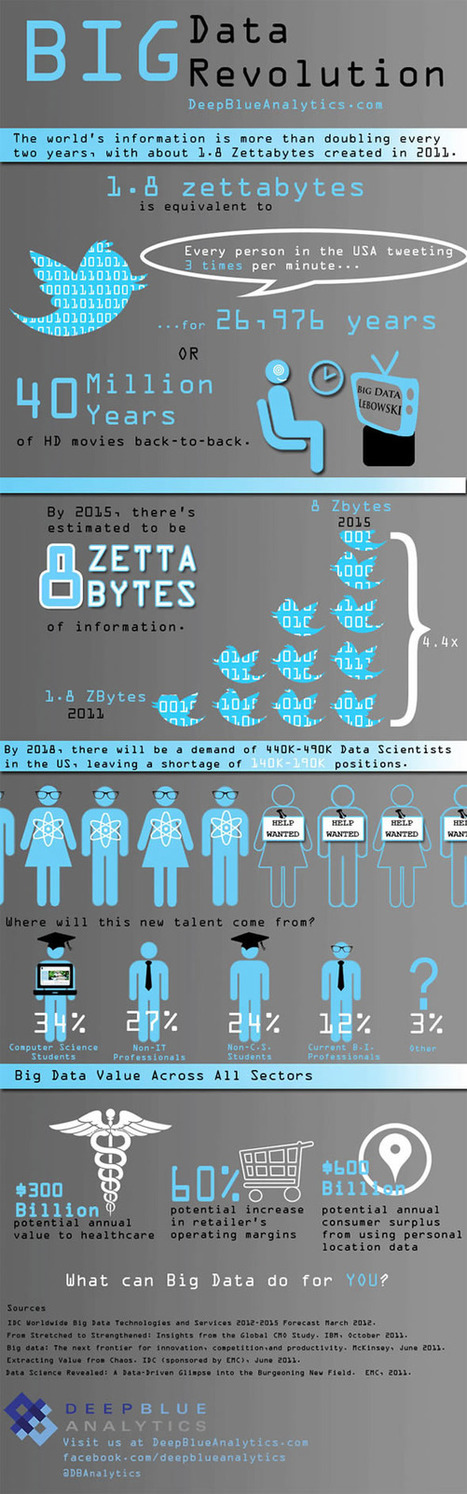
Is Big Data still a big mystery to you?
In recent years, the volume of information coming into companies has exploded, so that many IT organizations are dealing with extremely large sets of data.
IT leaders are rethinking many aspects of how they manage and deliver information, from investments in infrastructure and analytics tools to new policies for organizing and accessing data so they can deliver more of it, faster. They are concerned that if they don't have the right tools and architectures to deal with all that information, then big data can be a big problem. Check out these infographics on Big Data to see the impact...
Via Lauren Moss
|
|
Rescooped by
pa3geo
from visual data
|
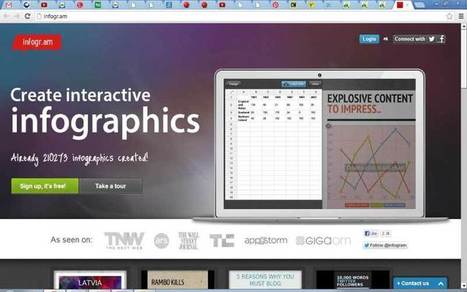
Want to create an attractive infographic but don’t have the budget to hire a professional designer? Then you should try using an infographic-creation tool. If your small business is looking for an eye-catching and easy to comprehend way to teach, inform, and inspire others about its products and services, infographics might be a good solution. Infographics can be more effective and memorable than other ways to present data, making them particularly effective for online audiences. To create an infographic, you should make a list of possible ideas that you want to get across, create the initial draft or skeleton, color scheme it, and research your content from authoritative sites. Then it’s time to select your design platform. Read about three online tools that can help you create stunning infographics...
Via Lauren Moss
|
|
Rescooped by
pa3geo
from visual data
|
From simple charts to complex maps and infographics, Brian Suda's round-up of the best – and mostly free – tools has everything you need to bring your data to life... A common question is how to get started with data visualisations. Beyond following blogs, you need to practice – and to practice, you need to understand the tools available. In this article, get introduced to 20 different tools for creating visualisations: from simple charts to complex graphs, maps and infographics. Almost everything here is available for free, and \you may have installed already...
Via Lauren Moss
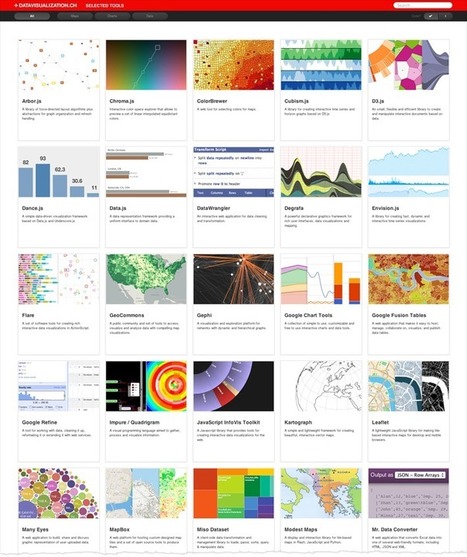
When I meet with people and talk about our work, I get asked a lot what technology we use to create interactive and dynamic data visualizations. At Interactive Things, we have a set of preferred libraries, applications and services that we use regularly in our work. We will select the most fitting tool for the job depending on the requirements of the project. Sometimes a really simple tool is all you need to create something meaningful. On other occasions, a more multifaceted repertoire is needed. But how does one choose the right thing to use? An endless list of every tool available, does not answer that question and a recommendation from a friend is oftentimes more valuable. That’s why we have put together a selection of tools that we use the most and that we enjoy working with. We called it selection.datavisualization.ch. It includes libraries for plotting data on maps, frameworks for creating charts, graphs and diagrams and tools to simplify the handling of data. Even if you’re not into programming, you’ll find applications that can be used without writing one single line of code. We will keep this list as a living repository and add / remove things as technology develops...
Via Lauren Moss, Pepe Crespo, Sonia C. Alonso
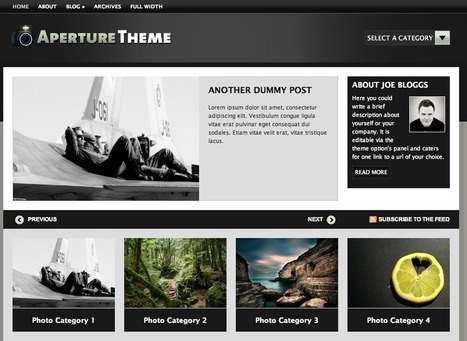
Discover these 12 *unusual* uses of the popular WordPress platform and build a plethora of creative websites using simple plugins. WordPress is the preferred blogging platform for over 35 million bloggers, and this WordPress Tutorial will show you some very interesting (yet uncommon) ways to use WordPress. Although the majority of users choose WordPress’ easy-to-use software for blogging, its power extends far beyond building blogs and static websites. In fact, with over 12,000 plugins available today, you can make your WordPress site do virtually anything you can imagine (well…. except for maybe cutting your grass)! Not only is it dynamic and capable of doing what you want, WordPress plugins do exactly what they are described to do and “plug right in to your WordPress blog”. This means that with simple configurations a world of opportunity is open to even the most basic user. To get your creative juices flowing, we’ve put together a list of our favorite uncommon uses of WordPress. Read more: http://blog.freeblogfactory.com/12-websites-you-can-build-with-wordpress/
Via Martin Gysler
That's a must read post, it'll learn you how you will become a Twitter power user! [note Martin Gysler] CNNFortune reported 100 million Twitter users log in at least once a month. Half of those, 50 million, log in every day. About 55% check in with mobile devices, while about 40% just check in without actually tweeting. Those numbers are huge for anyone who’s marketing online. But that’s not all. Thirty-four percent of marketers who use Twitter have generated leads from its use…with 20% of those closing deals. But how do you take advantage of this growing audience of Twitter consumers? You have to become a power user. So here are 100 proven tips to help you do just that. And to make it easier to follow along, I’ve broken them up into 10 sections that each contain 10 tips. Read more: http://www.quicksprout.com/2012/01/30/100-ways-to-become-a-twitter-power-user/
Via Martin Gysler
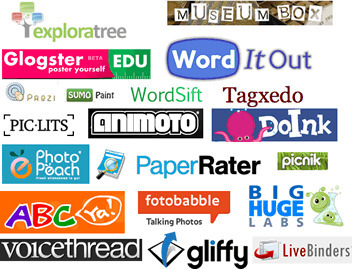
Great selection of Tools for Creativity in the Classroom...
Via Informatics
|