
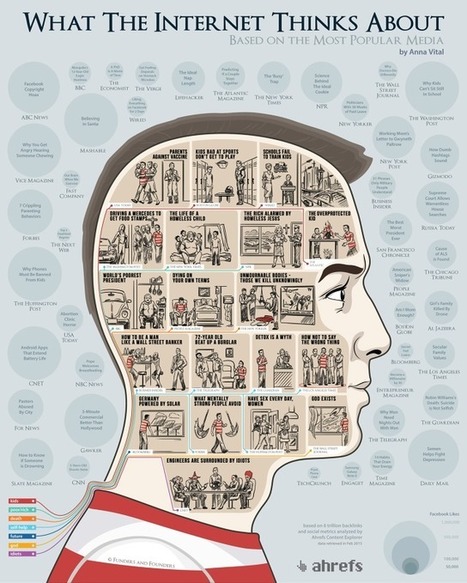

What does the Internet care about? What articles do we share the most? Using the data from the Ahrefs Content Explorer, the people at Funders and Founders
Via Lauren Moss
Get Started for FREE
Sign up with Facebook Sign up with X
I don't have a Facebook or a X account


 Your new post is loading...
 Your new post is loading...
Your new post is loading...
What does the Internet care about? What articles do we share the most? Using the data from the Ahrefs Content Explorer, the people at Funders and Founders Via Lauren Moss 
As people begin to experiment with the creation and interpretation of visualizations and including them in presentations, a not-so-apparent shift will take place in the background where the traditional ‘analyst’ role slowly morphs to give way to a new breed — the storytellers — who will be more strategic and consultative in nature and not data-waiters, statisticians or always comfortable with extreme analytics. Visualization, as we know it, is starting to spread through individual contributors and niche companies forging the path. A lot of these individuals are learning as they go and using available tools and technologies, but invariably data access and computing capabilities to specific information are limitations that still require heavy investments. As people begin to experiment with the creation and interpretation of visualizations and including them in presentations, a not-so-apparent shift will take place in the background where the traditional ‘analyst‘ role slowly morphs to give way to a new breed — the storytellers — who will be more strategic and consultative in nature and not data-waiters, statisticians or always comfortable with extreme analytics, but can create, interact, discover and explain relationships in the information and become the go-to people leadership looks for to understand and make quick decisions for their business through data... Via Lauren Moss
We now live in a world where information is potentially unlimited. Information is cheap, but meaning is expensive. Over the past several years, our quest to extract meaning from information has taken us more and more towards the realm of visual storytelling — we’ve used data visualization to reveal hidden patterns about the world, employed animation in engaging kids with important issues, and let infographics distill human emotion. In fact, our very brains are wired for the visual over the textual by way of the pictorial superiority effect. Via Lauren Moss
|
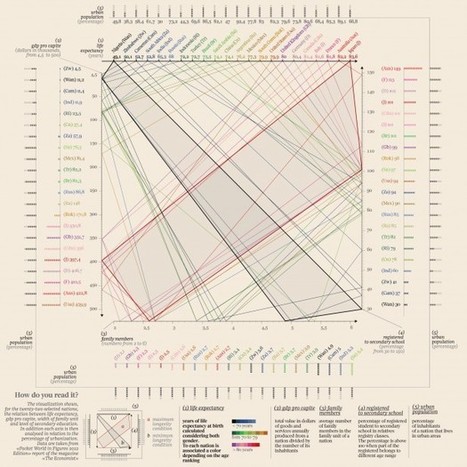
Accurat is a design agency and consultancy based in Milan, Italy, transforming data into meaningful stories, and developing multimedia narratives and interactive applications.
Our studio doesn’t have a formal information visualization education background. The four associates have majors in completely different fields: Architecture, Sociology, Design and Economics. This is a strange skill composition for a design studio, but indeed it’s what brings novelty in Accurat’s body of work. When working on information visualization, this multifaceted background clearly emerges, leading to the design of unorthodox visual metaphors, where our focus is on the data analysis, theories and storytelling side.
In practice, this translates into a very straightforward process in the design of the visualizations: instead of starting with a selection of the most proper metaphor among widely used models of graphs, charts and tables, the visual starts with the story we want to tell, without any constriction from a chosen format. This way, it’s way easier to break rules, merge ideas together and come up with naive but powerful and new visual schemes...
Read the complete article for a detailed and comprehensive look at this unique approach to vizualization, storytelling and the process it takes to achieve successful and creative results, as explained with project examples and case studies. Via Lauren Moss

Rae Ann Fera: "The legendary writer and actor has also become a well-known student of and speaker on creativity and how to cultivate it. He recently enlightened a group of ad types about the best ways to put yourself in a creative state of mind" ...
" “Guy Claxton, the author of Hare Brain, Tortoise Mind, says there are two kinds of thinking: one dependent on reason and logic, and one that’s less purposeful, it’s more playful, leisurely, and dreamy. In this mode, we are mulling things over, almost meditative, pondering a problem versus earnestly trying to solve it. He says allowing the mind time to meander is not a luxury. You need the tortoise mind, such as Einstein described, as much as you need the hare brain." " Via The Digital Rocking Chair, Arno Neumann, Sakis Koukouvis
|


Interesting insight into the internet
At least, the concern about equality, energy and social welfare is there. I like the last one about engineers tho. Hahaha.
I think this article is awesome because they use data visualization to show what people share the most, visit the most, and search the most. Data is everywhere and people are using it everyday and sometimes don't even think about it.