

A totally free presentation software that helps to create amazing presentation. It is highly compatible with Microsoft PowerPoint, and supports converting ppt to PDF.
Via aikker, Informatics
Get Started for FREE
Sign up with Facebook Sign up with X
I don't have a Facebook or a X account


 Your new post is loading...
 Your new post is loading...
Your new post is loading...
A totally free presentation software that helps to create amazing presentation. It is highly compatible with Microsoft PowerPoint, and supports converting ppt to PDF. Via aikker, Informatics 
No comment yet.
Sign up to comment

Art, maps,imagery and graphs add context and a visual component to numbers, locations, and information. With as much influx of data we contend with on a daily basis, visualization tools allows our brains to take a rest while perceiving content in a different light. In essence, visualization allows us to stop and smell the pixels, in spite of the fact we might learn a few things along the way. Visualization is a technique to graphically represent sets of data that makes it easier to read and understand. Tools for visualization exist in search, social networks, online communities, mobile apps and desktop applications. Check out of some of the most unique visualization tools available today... Via Lauren Moss
|
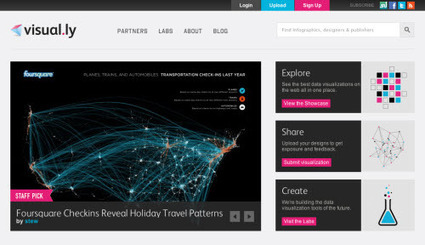
There are plenty of cool technologies available to collect and examine data. Both web and desktop applications have provided some really great interfaces to fall in love with data mining, and with the rise in popularity we have noticed an increased number of infographics created over the past few years. Via Lauren Moss
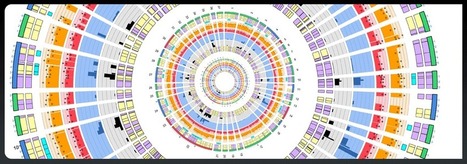
Circos is a software package for visualizing data and information. It visualizes data in a circular layout — this makes Circos ideal for exploring relationships between objects or positions. Circos is ideal for creating publication-quality infographics and illustrations with a high data-to-ink ratio, richly layered data and pleasant symmetries. You have fine control each element in the figure to tailor its focus points and detail to your audience. Via Baiba Svenca
|


