omnia mea mecum fero
14.2K views | +0 today
Follow
omnia mea mecum fero
όλα τα δικά μου τα κουβαλάω πάνω μου
Curated by pa3geo
Your new post is loading...
Rescooped by pa3geo from visual data
Scoop.it!

Create infographics that demand attention with these online tools

Create infographics that demand attention with these online tools | omnia mea mecum fero | Scoop.it

Want to create an attractive infographic but don’t have the budget to hire a professional designer?

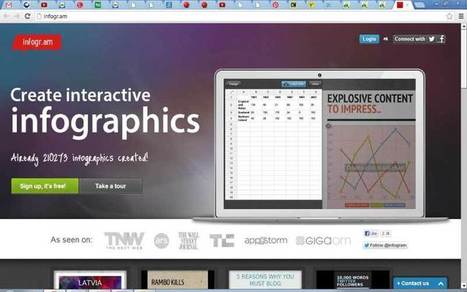
Then you should try using an infographic-creation tool.

If your small business is looking for an eye-catching and easy to comprehend way to teach, inform, and inspire others about its products and services, infographics might be a good solution. Infographics can be more effective and memorable than other ways to present data, making them particularly effective for online audiences.

To create an infographic, you should make a list of possible ideas that you want to get across, create the initial draft or skeleton, color scheme it, and research your content from authoritative sites. Then it’s time to select your design platform.


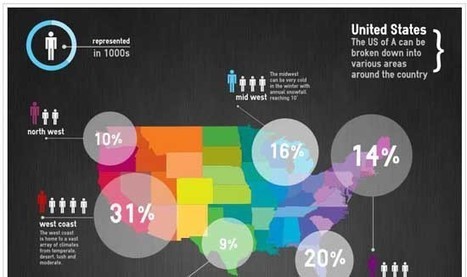
Read about three online tools that can help you create stunning infographics...


Via Lauren Moss
No comment yet.
Rescooped by pa3geo from visual data
Scoop.it!

10 Best Tools for Creating Infographics

10 Best Tools for Creating Infographics | omnia mea mecum fero | Scoop.it
We have a list of 10 Best Tools for Creating Infographics. Making infographics from scratch can be a tough as and not all the people can do it.

This is where some tools can help — numerous resources are available to help you while designing and creating infographics. Graphics and visualization samples from each website are included in this list, so you can visit each link and see the infographics directly from the source.

Check out this list of 10 Best Tools for Creating Infographics, and find the ones that suit your needs the best...


Via Lauren Moss
No comment yet.
Rescooped by pa3geo from visual data
Scoop.it!

The top 20 data visualisation tools

The top 20 data visualisation tools | omnia mea mecum fero | Scoop.it

From simple charts to complex maps and infographics, Brian Suda's round-up of the best – and mostly free – tools has everything you need to bring your data to life...

A common question is how to get started with data visualisations. Beyond following blogs, you need to practice – and to practice, you need to understand the tools available. In this article, get introduced to 20 different tools for creating visualisations: from simple charts to complex graphs, maps and infographics. Almost everything here is available for free, and \you may have installed already...


Via Lauren Moss
Randy Rebman's curator insight, January 28, 2013 12:33 PM

This looks like it might be a good source for integrating infographics into the classroom.