Information graphics or infographics are graphic visual representations of information, data or knowledge. These graphics present complex information quickly and clearly, and are easy to understand.
Infographics are sources of interesting information, when you are in need of some. Reading boring, long, colorless articles isn’t so attractive and interesting than reading and viewing facts and numbers in an illustrated way. Not only an illustrated way, but a very creative, attractive and super-appealing way.
All of them have been designed not only to look good, but also to expose the maximum information and data possible. These infographics were made by some very talented designers, with creative minds and superb skills.
While there are lots of really interesting and cool infographics on various topics, in this post we have only gathered awesome infographics which are of interest to web designers and developers...
Via
Lauren Moss


 Your new post is loading...


![The Value of Data Visualization [infographic video] | omnia mea mecum fero | Scoop.it](https://img.scoop.it/IalOa5pmfaGk11Q_JAhRATl72eJkfbmt4t8yenImKBVvK0kTmF0xjctABnaLJIm9)


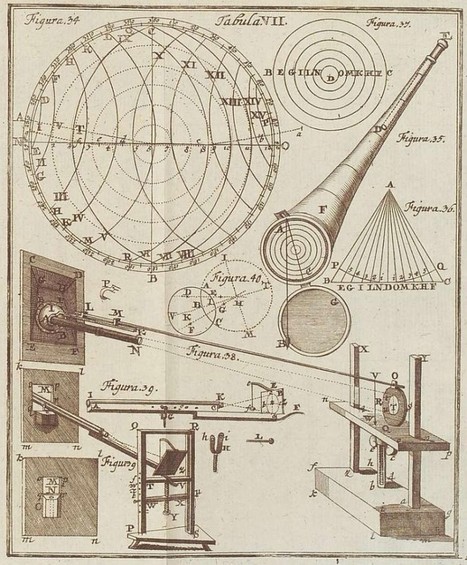
muito legal, os Infográficos antes de existir a internet. 35 exemplos de infográficos no papel :) Achei falta do Marcha para Moscou do Minard http://www.datavis.ca/gallery/re-minard.php ;
El brasileño Tiago Veloso, fundador de Visual Loop, nos ofrece 35 interesantísimas representaciones visuales de distintos fenómenos y eventos que permiten hacer un paseo por la historia de la ilustración científica.