A visual history of human sensemaking, from cave paintings to the world wide web.
Since the dawn of recorded history, we’ve been using visual depictions to map the earth, order the heavens, make sense of time, dissect the human body, organize the natural world, perform music, and even decorate abstract concepts like consciousness and love.
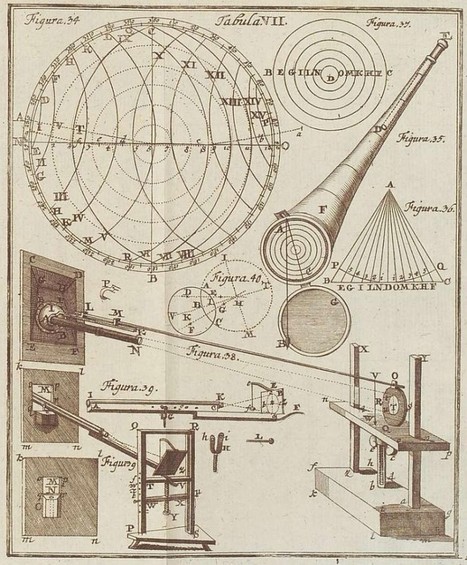
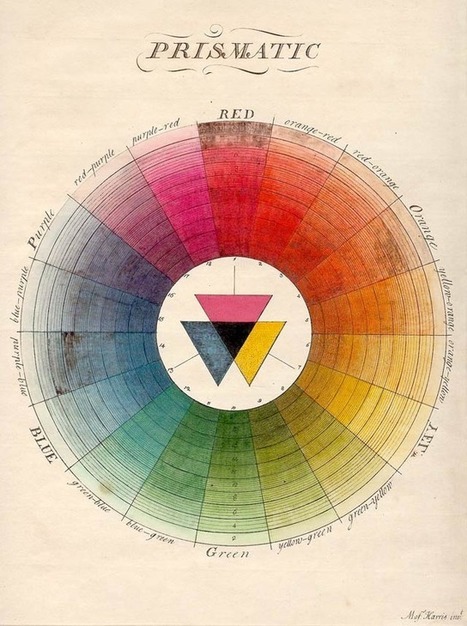
100 Diagrams That Changed the World by investigative journalist and documentarian Scott Christianson chronicles the history of our evolving understanding of the world through humanity’s most groundbreaking sketches, illustrations, and drawings, ranging from cave paintings to The Rosetta Stone to Moses Harris’s color wheel to Tim Berners-Lee’s flowchart for a “mesh” information management system, the original blueprint for the world wide web.
But most noteworthy of all is the way in which these diagrams bespeak an essential part of culture — the awareness that everything builds on what came before, that creativity is combinational, and that the most radical innovations harness the cross-pollination of disciplines.
Via
Lauren Moss


 Your new post is loading...


muito legal, os Infográficos antes de existir a internet. 35 exemplos de infográficos no papel :) Achei falta do Marcha para Moscou do Minard http://www.datavis.ca/gallery/re-minard.php ;
El brasileño Tiago Veloso, fundador de Visual Loop, nos ofrece 35 interesantísimas representaciones visuales de distintos fenómenos y eventos que permiten hacer un paseo por la historia de la ilustración científica.