omnia mea mecum fero
14.2K views | +0 today
Follow
omnia mea mecum fero
όλα τα δικά μου τα κουβαλάω πάνω μου
Curated by pa3geo
Your new post is loading...
Rescooped by pa3geo from visual data
Scoop.it!

Infographic: 4,000 Years Of Human History Captured In One Retro Chart

Infographic: 4,000 Years Of Human History Captured In One Retro Chart | omnia mea mecum fero | Scoop.it

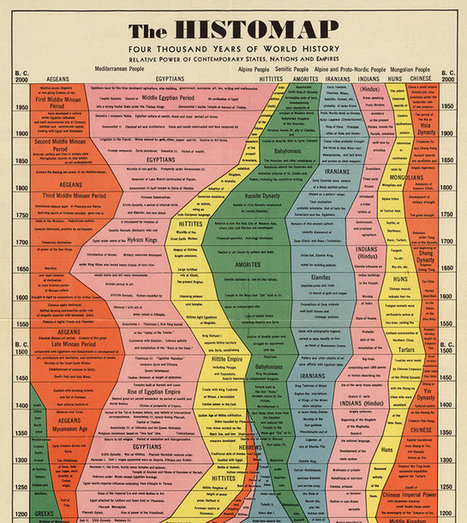
If time is a river, the Histomap, first published by Rand McNally back in 1931, is a raging Mississippi. In that massive river of time, each of humanity’s great civilizations becomes a confluence that ebbs, wanes, and sometimes ebbs again, each a separate current in a river that inexorably rages down to the mouth of the present day.

Although certainly not modern, the Histomap is still a breathtaking example of good infographic design: A five-foot, roll-up chart that can fit an overview of human history on any wall. Starting in 2000 B.C. with seven different civilizations--the Aegeans, the Egyptians, the Hittites, the Amorites, the Iranians, the Indians, the Huns, and the Chinese--you travel forward or backward in time as your eyes move up or down 0.75 inches. Some civilizations bleed together, others are swallowed up; some surge, others crash...


Via Lauren Moss
Brian Sullivan's curator insight, August 16, 2013 11:56 PM

Heres a great

Sieg Holle's curator insight, August 30, 2013 9:56 AM

We can learn from history 

Rescooped by pa3geo from visual data
Scoop.it!

100 Diagrams That Changed the World

100 Diagrams That Changed the World | omnia mea mecum fero | Scoop.it

A visual history of human sensemaking, from cave paintings to the world wide web.


Since the dawn of recorded history, we’ve been using visual depictions to map the earth, order the heavens, make sense of time, dissect the human body, organize the natural world, perform music, and even decorate abstract concepts like consciousness and love.

100 Diagrams That Changed the World by investigative journalist and documentarian Scott Christianson chronicles the history of our evolving understanding of the world through humanity’s most groundbreaking sketches, illustrations, and drawings, ranging from cave paintings to The Rosetta Stone to Moses Harris’s color wheel to Tim Berners-Lee’s flowchart for a “mesh” information management system, the original blueprint for the world wide web.

But most noteworthy of all is the way in which these diagrams bespeak an essential part of culture — the awareness that everything builds on what came before, that creativity is combinational, and that the most radical innovations harness the cross-pollination of disciplines.


Via Lauren Moss
Patrizia Bertini's curator insight, December 30, 2012 5:59 AM

I see! - goes together with embodied cognition? It seems so... Infographics as a key?

bancoideas's curator insight, December 30, 2012 9:28 AM

Ideas acerca de las ideas que tenemos sobte nosotros/as mismos/as y el mundo que co-construimos

Denise Eler's curator insight, June 30, 2015 7:26 PM

Quando um gestor pede que uma apresentação de 80 slides seja condensada em 3 slides, ou uma página A3, não tenha dúvida: isto vai exigir de você mais que capacidade de síntese textual. Pensar visualmente, especialmente, criando diagramas é uma competência valiosa. Vejo isso durante meus cursos e vivência com profissionais das mais variadas indústrias. A boa notícia é que dá para aprender ;)

Rescooped by pa3geo from Science News
Scoop.it!

How Colors Get Their Names: It's in Our Vision

How Colors Get Their Names: It's in Our Vision | omnia mea mecum fero | Scoop.it
The order in which colors are named worldwide appears to be due to how eyes work, suggest computer simulations with virtual people.

Via Sakis Koukouvis
No comment yet.
Rescooped by pa3geo from visual data
Scoop.it!

Infographic: An Amazing, Invisible Truth About Wikipedia

Infographic: An Amazing, Invisible Truth About Wikipedia | omnia mea mecum fero | Scoop.it

Every Wikipedia entry has an optional feature we take for granted--geotagging. An entry on the Lincoln Memorial will be linked to its specific latitude and longitude in Washington D.C. On any individual post, this may or may not be a useful thing. But what about looking at these locations en masse?

That was a question asked by data viz specialist and programmer Olivier Beauchesne. To find out, he downloaded all of Wikipedia (it’s open-source, after all) then used an algorithm that would assemble 300 topical clusters from popular, related keywords. Then he placed the location of each article in these topical clusters on a map. What he found was astounding...


Via Lauren Moss
No comment yet.
Rescooped by pa3geo from Science News
Scoop.it!

Did Humans Invent Music?

Did Humans Invent Music? | omnia mea mecum fero | Scoop.it

Did Neanderthals sing? Is there a “music gene”? Two scientists debate whether our capacity to make and enjoy songs comes from biological evolution or from the advent of civilization.


Via Sakis Koukouvis
No comment yet.
Rescooped by pa3geo from Science News
Scoop.it!

What's in a surname? New study explores what the evolution of names reveals about China

What's in a surname? New study explores what the evolution of names reveals about China | omnia mea mecum fero | Scoop.it
What can surnames tell us about the culture, genetics and history of our society?

Via Sakis Koukouvis
No comment yet.