


Follow this guide on how to shield yourself and your company from cyberattack via malicious emails.
Get Started for FREE
Sign up with Facebook Sign up with X
I don't have a Facebook or a X account


 Your new post is loading...
 Your new post is loading...
Your new post is loading...
Follow this guide on how to shield yourself and your company from cyberattack via malicious emails. 
No comment yet.
Sign up to comment
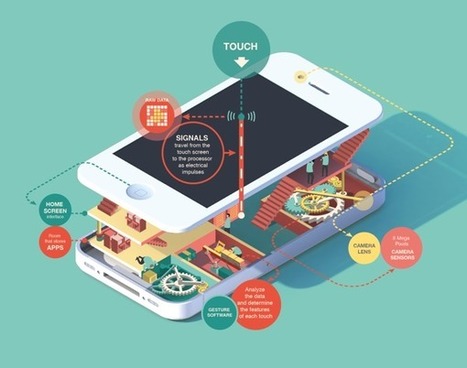
The main reason why infographics are so successful is that they transpose written data into a visual representation of the ideas that information contains. Visual data is absorbed much more quickly and easily, which leads to faster understanding. The majority of the population learns best through visual stimuli as shown in research undertaken into Individual learning styles, which is why for advertising companies, such as those involved in ecig marketing, relevant information is delivered in a visually interesting, coherent and direct way. Via Jeff Domansky, DKW Online, Stephania Savva, Ph.D

Jeff Domansky's curator insight,
April 11, 2015 2:33 AM
Infographics work because we can process visuals faster. So what are you waiting for? Try your hand at creating your own infographics.

Alison lee's curator insight,
May 20, 2015 11:19 PM
THE PHOTO INFOGRAPH: it is visually appealing and interacts with the reader playfully, however because it has to be more visual and use less text, it misses more specific information and stays instead more general |
From
medium

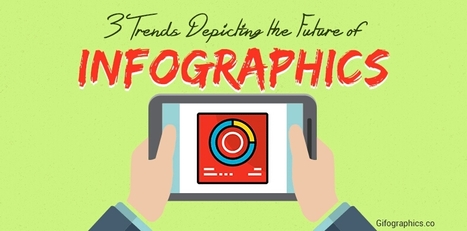
As a marketer, your content strategy is very important. Blogs, articles, social media posts, slide presentations, etc. There are so many ways to market your content. But in the last few years, infographics have caught the attention of online marketers and media professionals. They feature a combination of text, design, and images to convert complex data into an easy-to-read piece of content.With evolving visual communication, infographics are now focusing on driving flexibility, shareability, and audience engagement. The three trends that will help you in doing so are... Via Jeff Domansky

DigitalVibes's curator insight,
October 27, 2017 2:54 PM
Las infografías llaman la atención en el sector del marketing porque combinan texto, diseño e imagen para convertir datos complejos en contenidos de fácil comprensión.
Las tres tendencias actuales en el mundo de la infografía son: 1- Diseño Modular: "crear secciones claras y exclusivas para varios tipos de datos. Esto permite ver las secciones como partes indiviuales de un contenido o como una parte de una infografía". 2- Storytelling: "transportar al usuario de una narrativa a otra, crear una experiencia para ellos y dejarles participar en ella". 3- Contenido Divisible: "crear una pieza central de contenido que puede fragmentarse en muchas". En este enlace se puede seguir leyendo el artículo propuesto y también se explica cada tendencia mediante una infografía: También lanzamos la siguiente pregunta: ¿Cómo pueden ayudar estas tres tendencias en e ámbito periodístico?

Well, I’m here to tell you that it’s definitely possible to create some awesome infographics in any category that you choose, EVEN if you’re not a designer. In this blog post, I’m going to introduce you to three awesome tools to create the best infographics, tell you how to use them AND how you can share your infographics in different channels all over the web. So, let’s get started!.. Learn more: - http://www.scoop.it/t/21st-century-learning-and-teaching/?tag=Infographics Via Jeff Domansky, Gust MEES

Well Connected Mom's curator insight,
April 10, 2015 4:11 PM
Infographics makes statistics visually interesting and more palatable. 
Daniel de Lisle's curator insight,
April 23, 2015 5:05 PM
New to infographics and want to get a handle on how to make complex data speak to your clients then read on. |


Phishing emails are on the rise. And it's just the beginning.