
![Who's Afraid of the Big Bad Cloud? [INFOGRAPHIC] | The MarTech Digest | Scoop.it](https://img.scoop.it/xkFN0eaXIlYLwHtDDFdjMvL6dadsvGA8m9WNoVsbzkY=)

This infographic looks at why some organizations have been slow to adapt to cloud computing.
Get Started for FREE
Sign up with Facebook Sign up with X
I don't have a Facebook or a X account


 Your new post is loading... Your new post is loading...
This infographic looks at why some organizations have been slow to adapt to cloud computing. 
No comment yet.
Sign up to comment
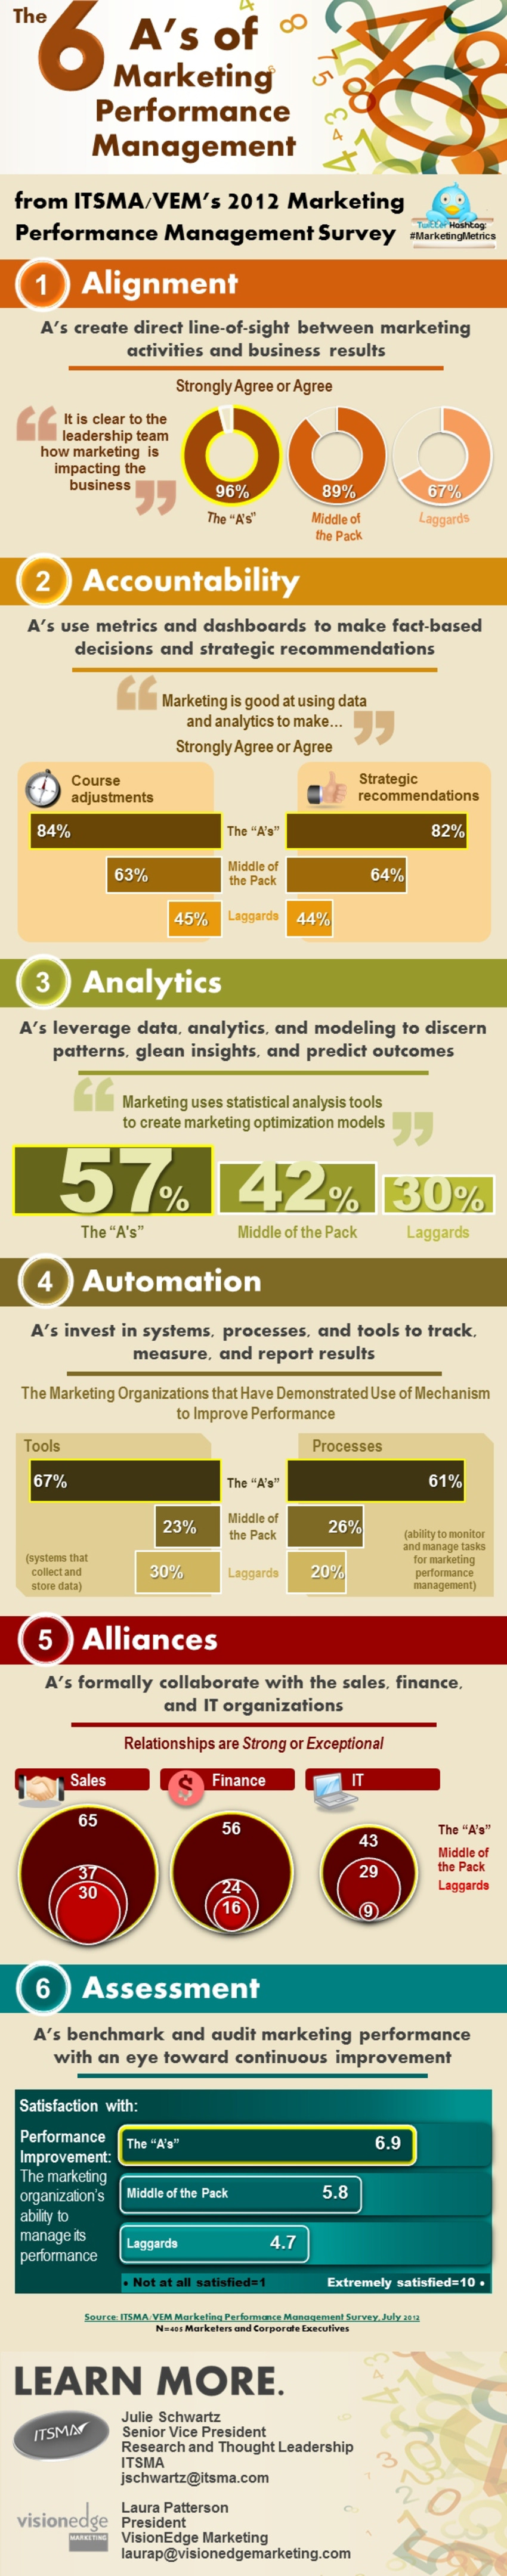
General Management - What grade would your CEO give your marketing organization for its ability to demonstrate its impact on the business?
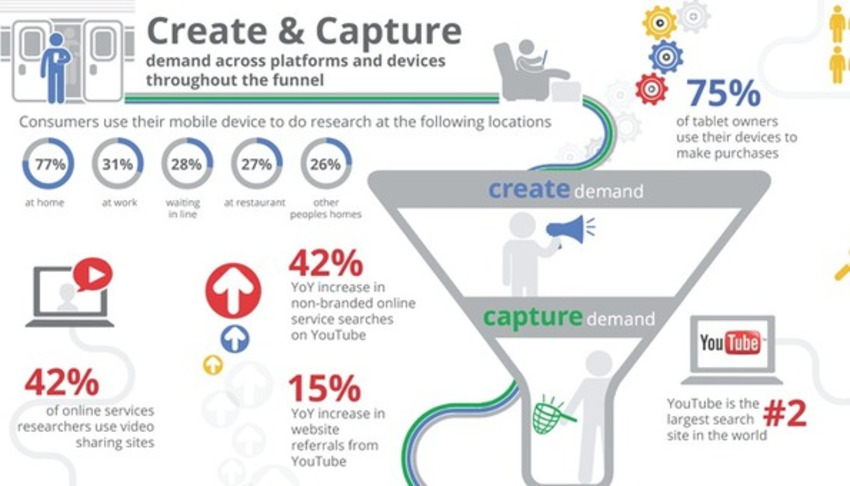
An infographic to illustrate how performance advertisers can create and capture demand across platforms and devices throughout the funnel.
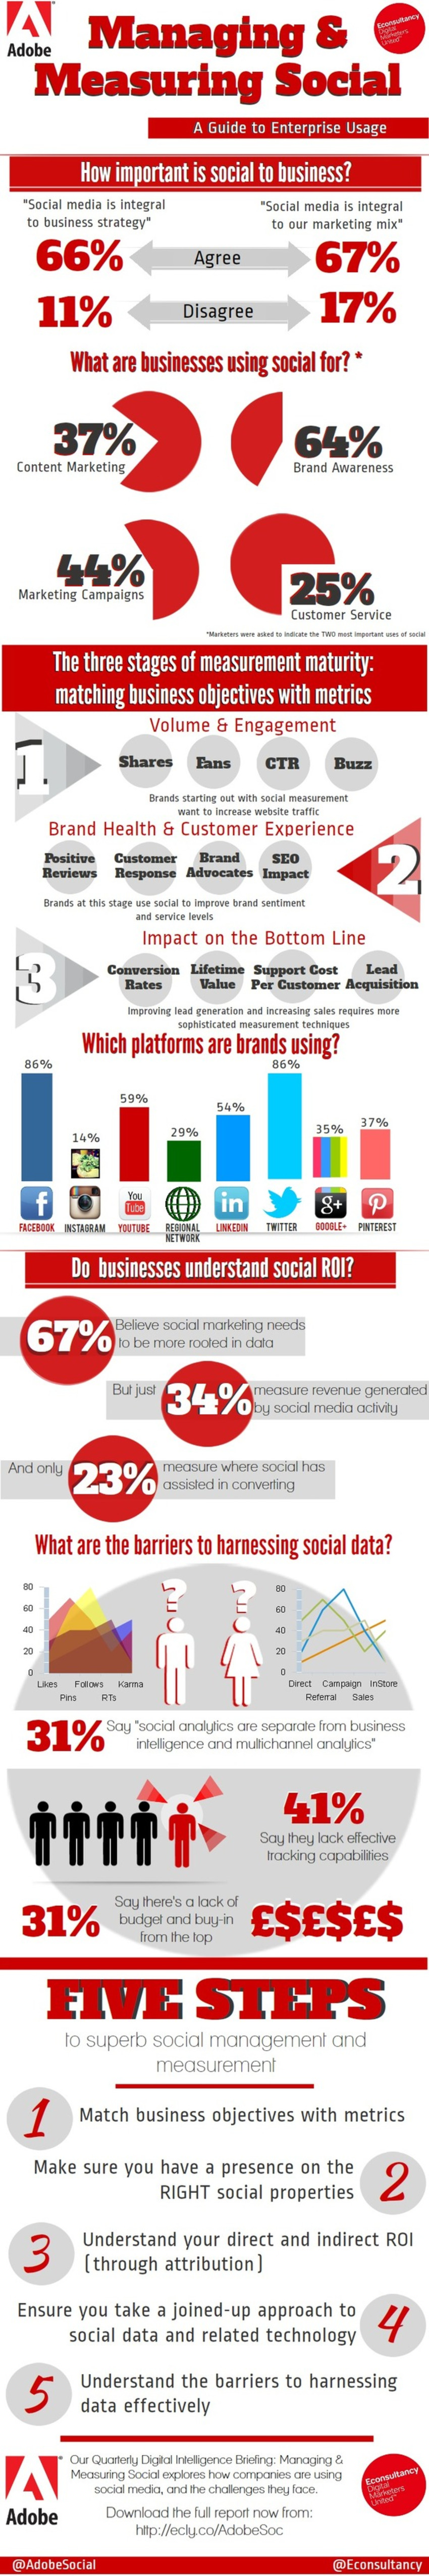
New research from Econsultancy and Adobe found that two-thirds of businesses (67%) agree that social media is integral to their marketing mix, while 66% say social is integral to their overall business strategy.
![Four Steps to a Social Media Strategy [Infographic] | The MarTech Digest | Scoop.it](https://img.scoop.it/LFHhWQn1VgNw8VvS8rr-J_L6dadsvGA8m9WNoVsbzkY=)
Social Media - Engaging your customers online requires more than just being on the same social networks they are on. You first need to determine what your goals are for social media, how ...

Bk Chin's curator insight,
May 9, 2013 7:15 AM
Social media has become one of most important factors of building a business strategy in today's market. Businesses should focus on creating many social media sites so that they can better approach to customers and to success, since it is now hard to get consumers to engage with the products of the business. 
Stella Gao's comment,
May 9, 2013 12:57 PM
This article is clearly to show how to develop a social media strategy. As social media become more and more important nowadays, we have to get better understand about that.

Wincy Cai's comment,
May 9, 2013 6:55 PM
The reason why all businesses need to get better understand about social media is because it prevents any misunderstandings and emphasizes why social media is relevant to your business’ overall goals.
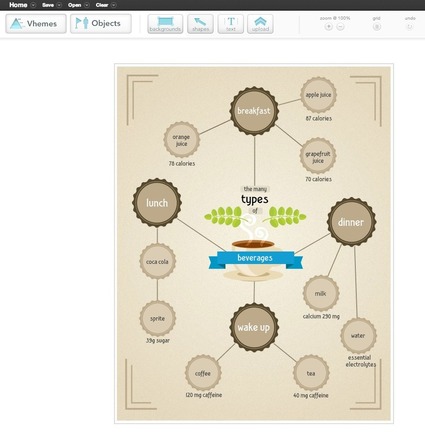
Easelly Easelly allows you to create your own infographics using its ‘Vhemes’, which are infographic templates that you can customise. It does a good line in icons and graphics too.
Piktochart We’ve used Piktochart to create some of our own infographics. It provides you with a choice of six free templates (more are available if you upgrade). Colour themes are easy to change, and you can create charts manually or by uploading CSV files.
Infogram Infogram is very easy to use, with six templates, and - infographics aside - it is also great for creating standalone charts.
Creately Creately is a ‘diagramming’ tool, which can help you to wireframe an infographic before putting it into production. It includes a new real-time collaboration feature, allowing you to work on a design with a colleague or client simultaneously.
Visually Visually has templates that allow you to create infographics based around Twitter or Facebook data. Alternatively, and if you don’t have the time to produce your own infographic, then check out the Visually marketplace. They start from $1,495 and typically take at least 18 days to produce.
Content Repurposing A lot of content marketing plans start with original content creation, but it’s just more practical to inventory existing digital assets, content objects, and media first. Most companies are not that well organized with their content, and when viewed through a content marketing opportunist’s lens, it’s usually not hard to find many ways to repurpose existing content resources.
Reusing content provides efficiency benefits, but if there are performance metrics, the data can reveal insights to make repurposing even more effective.
Content Co-Creation Another layer in your content plan that enables efficient and high-value content creation is to partner with others for creation. A co-creation example would be to reach out to clients, partners, employees, industry thought leaders, or even your brand’s social media community to participate in the creation of a new, remarkable content object.
Evergreen Content The creation of original content that remains relevant over time is one of the toughest parts of online marketing. However, it’s essential for creating marketable assets that convey the key messages designed specifically to attract, engage, and convert new business. A layer of evergreen content can work in concert with your other content efforts on a less frequent basis. In fact, evergreen content can serve as a leader for a topic during a cycle of time with other types of content to support it.
Content Curation Collecting interesting content on a regular basis and organizing it in a useful way can be a very efficient method for providing value with efficiency. Adding your own insight to curated content takes a little more time, but a lot less than creating new content or co-creation and repurposing projects.
Begin the process with a good idea. Infographics often answer questions, provide compelling data, or demystify a process. So brainstorm for topics that will intrigue your prospects and customers, because compelling infographics achieve tremendous reach when they're shared with colleagues and networks. Then..
Create a skeleton and flowchart. You have a topic—now create the visual map that outlines where your infographic is going and how it will get there. Think of this stage as your rough draft, something to refine and polish as you move toward a final draft.
Pick a color scheme. Understated elegance is wasted in most infographics. Choose an eye-friendly color scheme that pops off the screen. Think bold and bright.
Choose eye-catching graphics. Your audience wants the info, but they're naturally drawn to the graphic. So select visually appealing components that attract a reader's attention.
Research. An infographic might have playful tone, but its information must be solidly credible. Don't put a single piece of data into a chart, graph, or illustration unless it's supported by an authoritative source.
Provide facts and conclusions. But remember, people don't read infographics like they read whitepapers, so skip the complicated presentation of facts and figures. Instead, use simple charts and illustrations that enable readers to grasp your evidence and conclusions at a glance.
Edit, edit, edit. Your infographic tells a story, and like any story it benefits from a careful editing process. The end result should be a clear narrative that flows logically from beginning to end.

Alex's curator insight,
August 4, 2016 2:33 AM
7/10 internet users use social network to connect, share content and stay informed! That's big.

When should I publish my infographic? The most active time of day for social engagement usually starts in the late morning (though there is plenty of other data on the best time to post on social networks) and the ideal days for publishing are on either a Tuesday or Wednesday, which maps pretty closely to when you should announce news.
You should launch your infographic campaign early morning Tuesday launch would make the most sense here, from a day, time perspective. However, publishing your infographic might also hinge on whether you, your PR firm, or your infographic vendor have been able to land an exclusive with a publisher, in which case you’ll need to coordinate your release with theirs.
Also, it’s worth noting that the typical promotion “lifecycle” for an infographic lasts roughly a business week (Monday through Friday) before interest wanes. So it’s important to publish early in the week.
Where should I publish the infographic on my website? This is often the first question asked by clients once they receive the final version of the infographic image file. You should publish your infographic in two places: -Your blog as an announcement and “teaser preview” -In a resources-type section, where it will live ultimately and potentially where you might house all your “higher value” content and linkable assets
|

|


![A Supercharged Sales Force: Power Your Organization Via Mobile Sales Enablement [Infographic] | The MarTech Digest | Scoop.it](https://img.scoop.it/a7Sr43RTIiTLLtmpiJFsafL6dadsvGA8m9WNoVsbzkY=)
![New Study From LinkedIn Shows How User Mindset Affects Social Media Marketing [INFOGRAPHIC] | The MarTech Digest | Scoop.it](https://img.scoop.it/N-1zQGpO7p9CPUg0q1b24vL6dadsvGA8m9WNoVsbzkY=)
![The B2B Lead Generation Manifesto [Infographic] | Unbounce | The MarTech Digest | Scoop.it](https://img.scoop.it/GoQogXUmquD6dzTqxTXm-vL6dadsvGA8m9WNoVsbzkY=)
![How Marketers Are Measuring Content [INFOGRAPHIC] | The MarTech Digest | Scoop.it](https://img.scoop.it/l3iJKZ71O5FyzJEw0nVxkPL6dadsvGA8m9WNoVsbzkY=)
![Why are conversion rates so low? [infographic] | The MarTech Digest | Scoop.it](https://img.scoop.it/Pto0Ji7UmIaQCup5lt5qZfL6dadsvGA8m9WNoVsbzkY=)
![Three Myths of Social Media ROI [Infographic] | The MarTech Digest | Scoop.it](https://img.scoop.it/RYDE1Q1vvDeZ3rwQBMKIYvL6dadsvGA8m9WNoVsbzkY=)

![The Google AdWords Economy: CPCs, CTRs, Ad Impressions, Conversion Rates... [Infographic] | The MarTech Digest | Scoop.it](https://img.scoop.it/wJdLS0giMrpgV2VPOxqLAvL6dadsvGA8m9WNoVsbzkY=)

