

Before you plan your marketing strategy for 2018, have a look at a list of email marketing statistics and facts handpicked and compiled by EmailMonks.
Get Started for FREE
Sign up with Facebook Sign up with X
I don't have a Facebook or a X account


 Your new post is loading... Your new post is loading...
Before you plan your marketing strategy for 2018, have a look at a list of email marketing statistics and facts handpicked and compiled by EmailMonks. 
No comment yet.
Sign up to comment
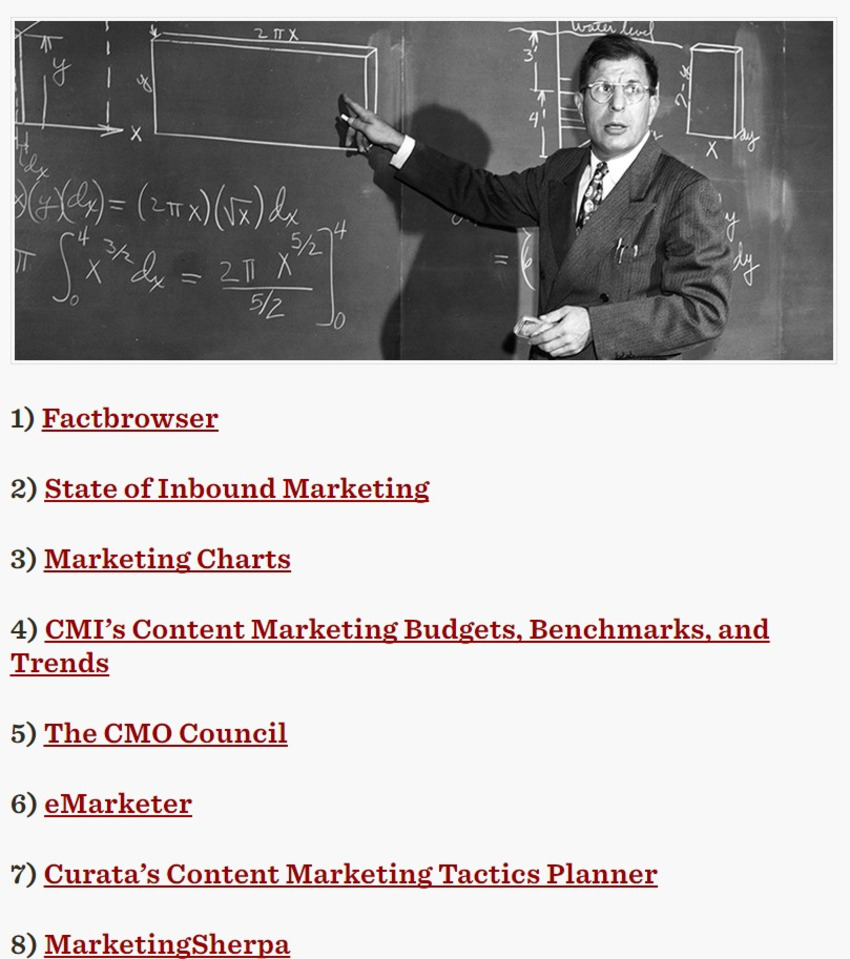
1. The Pareto Principle
Marteq's insight:
CT for the impact on online marketing.
BTW: missing is Schrodinger's cat.
Visualize your Marketing Stack. marketingIO will analyze your marketing technology and deliver a visual of your MarTech Stack. Free. Go here: http://go.marketingio.com/stack_analysis
#MarTech #DigitalMarketing

The probability of A happening in a world where B has happened is equal to … (The probability of B happening in a world where A has happened) times (The probability of A happening at all) divided by (The probability of B happening at all).
Marteq's insight:
FYI...
MarTech requires constant optimization to continually squeeze ever improving performance. No time for continual CRO? Contact us. #MarTech #DigitalMarketing
Epiphany #1: Large sample sizes dilute eccentricity
Marteq's insight:
CT for the devil in the details.
Email your comments to joe_rizzo@marketingIO.com. I’ll publish it here. marketingIO: One Source for All Marketing Technology Challenges. See our solutions.
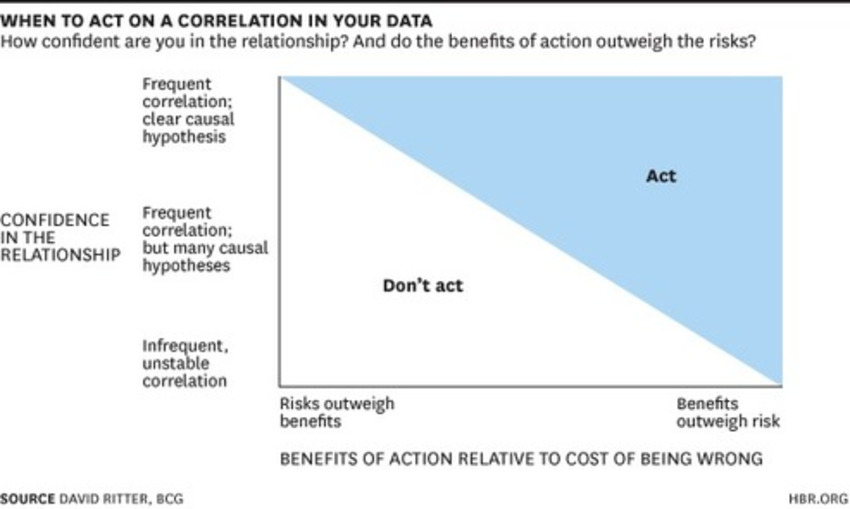
From
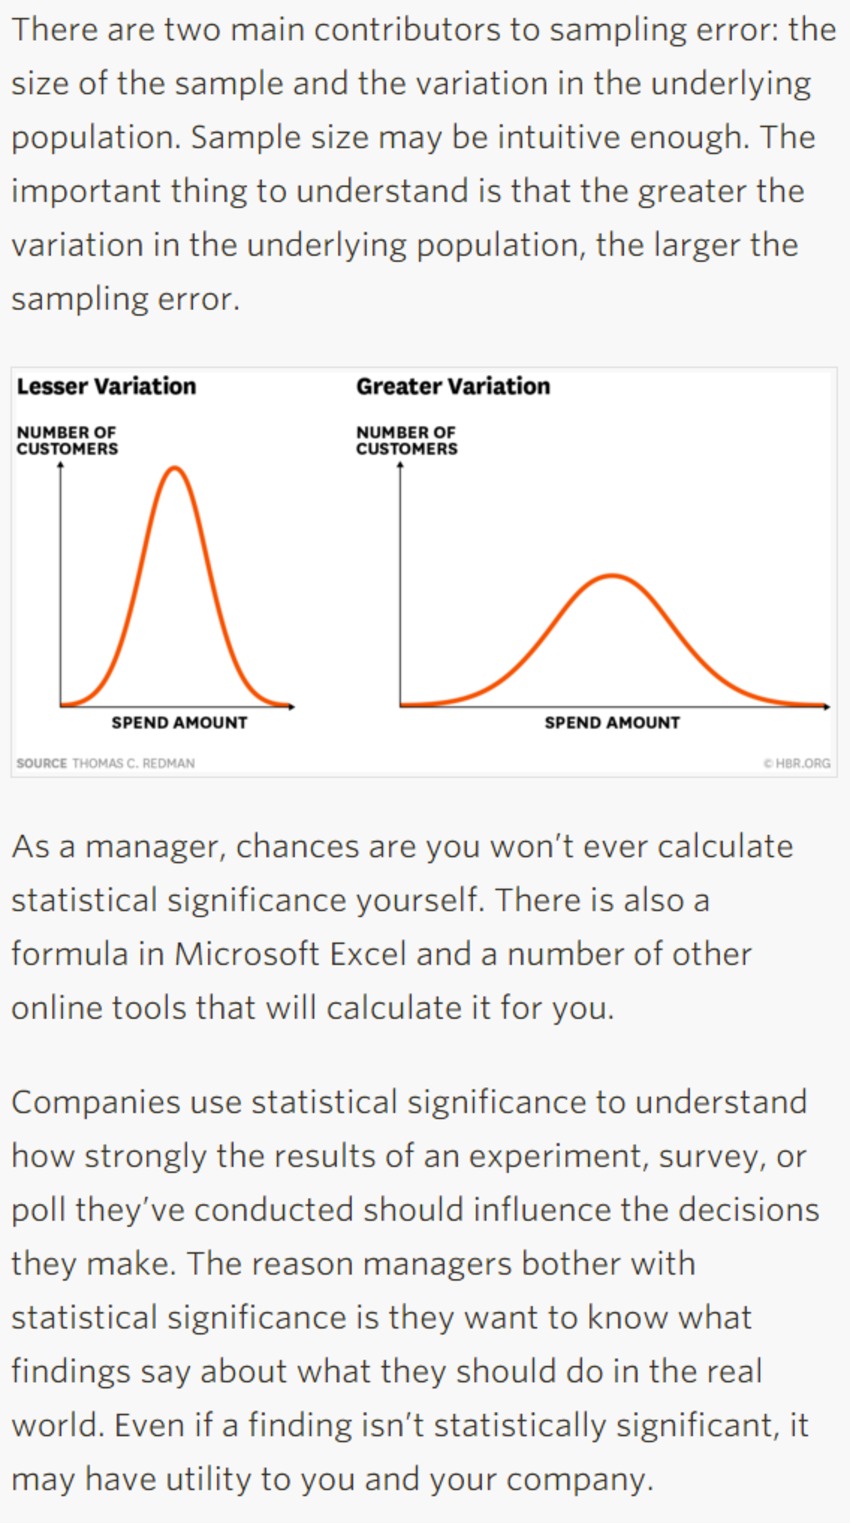
hbr

marketingIO: One Source for All Marketing Technology Challenges. See our solutions.
Marteq's insight:
I only scooped top-line to shake the dust off, but more when clicking through.
From
hbr
You probably know by now that whenever possible you should be making data-driven decisions at work. But do you know how to parse through all of the data available to you? The good news is that you likely don’t have to do the number crunching yourself (hallelujah!) but you do need to correctly understand and interpret the analysis created by your colleagues. One of the most important types of data analysis is regression. marketingIO: One Source for All Marketing Technology Challenges. See our solutions.
Marteq's insight:
If you've forgotten or you just need a quicker refresher, here you go.
iNeoMarketing.com bridges the gap between your MarTech and your in-house experience. Contact us.
Marteq's insight:
FWIW: quite often there is duplicate data. Not always, but often. So if you're not suffering from Stat FOMO, pick 4-5 and you're fine.
Receive a FREE daily summary of The Marketing Technology Alert HERE ↑↑↑↑↑↑↑↑↑↑↑↑↑↑↑↑↑↑↑↑↑↑↑↑↑↑↑
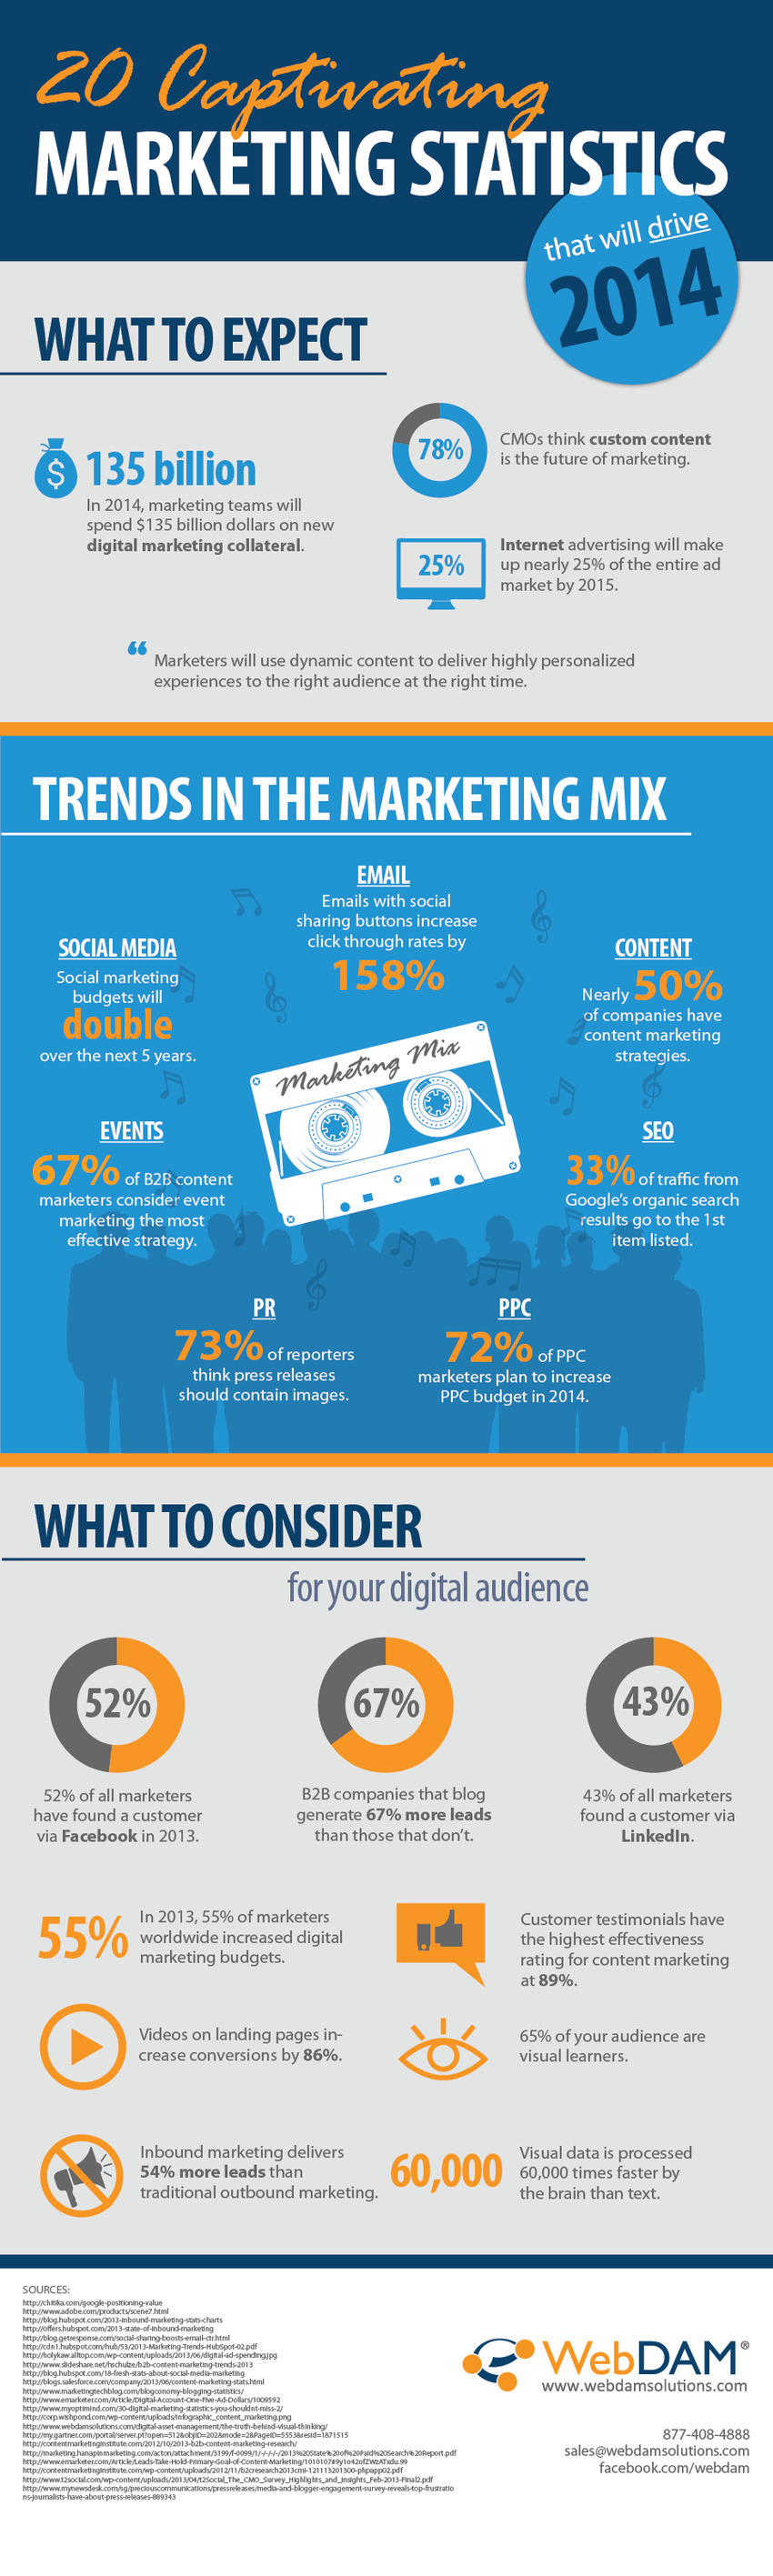
WebDAM Solutions created this infographic to illustrate how the marketing world perceives the trends that will drive efforts going into 2014.
___________________________________ -Receive a FREE daily summary of The Marketing Technology Alert directly to your inbox. To subscribe, please go to http://ineomarketing.com/About_The_MAR_Sub.html (your privacy is protected). -If you like this scoop from The Marketing Technology Alert (brought to you by iNeoMarketing), PLEASE share by using the links below.
Marteq's insight:
Scattered yet entertaining.
![[INFOGRAPHIC] 26 Digital Marketing Statistics You Shouldn't Miss - Optimind | #TheMarketingAutomationAlert | The MarTech Digest | Scoop.it](https://img.scoop.it/p7W0JDRdePVJJ633LUecqfL6dadsvGA8m9WNoVsbzkY=)
26 Digital Marketing statistics you shouldn't miss with downloadable quick reference infographic.
Marteq's insight:
More stats 'n facts to support your 2014 budgeting.

When trying to make sense of data, it's easy to fall victim to confirmation bias, irrelevancy, statistical insignificance, and causation vs. correlation and action vs. intent confusion. Here are solutions to these (and more) common analysis problems. Summarized... 1. Confirmation Bias: You have a hypothesis in mind but you are only seeking data patterns that support it – ignoring all data points that reject it. 2. Irrelevancy and Distraction: Focusing on data that is irrelevant to the problem you are trying to solve or being distracted by data that isn't directly connected to your analysis goal. In the age of Big Data, this is doomed to happen more and more. 3. Causation vs. Correlation: Mixing the cause of a phenomenon with correlation. If one action causes another, then they are most certainly correlated. But just because two things occur together doesn't mean that one caused the other, even if it seems to make sense. 4. Statistical Significance: Using data sets that are too small to suggest a trend or comparing results that are not different enough to have statistical significance. 5. Action vs. Intent: Inferring the wrong intention based on the actions recorded in the data rather than the suggested intent. 6. Apples and oranges: Comparing unrelated data sets or data points and inferring relationships or similarities. 7. Poor data hygiene: Analyzing incomplete or "dirty" data sets and making decisions based on the analysis of that data. 8. Narrow focus/not enough data: Analyzing data sets without considering other data points that might be crucial for the analysis (for example, analyzing email click-through rate but ignoring the unsubscribe rate). 9. Bucketing: The act of grouping data points together and treating them as one. For example, looking at visits to your website and treating unique visits and total visits as one, inflating the actual number of visitors but understating your true conversion rate. 10. Simple mistakes and oversight: "It happens to the best of us."
Marteq's insight:
The title reads 5, but there are actually 10. And the author provides a solution to the first five. Regardless of the status of Big Data in your organization, this is a must-review article! We're all statisticians now!
|

|


Email Marketing Statistics to Guide your Email Strategy in 2018 - EmailMonks
Many more stats when you click through.
This news comes to you compliments of marketingIO.com. #MarTech #DigitalMarketing