The MarTech Digest
563.0K views | +0 today
Follow
Your new post is loading...
Scooped by Marteq
Scoop.it!

How to Repurpose Your Blog Content as Infographic - Mention

How to Repurpose Your Blog Content as Infographic - Mention | The MarTech Digest | Scoop.it
Step 1: Trim the fat and create an outline
Step 2: Structure your template
This is the easy part, because you don’t need to be an infographic design wiz in order to produce a solid infographic template. Start out by choosing your favorite infographic generator. In this case, I naturally recommend Venngage, because I’m biased.
Step 3: Outreach and repurpose
Marteq's insight:

MarTech is the best tool available to bridge the gap between Sales and Marketing. Contact us to see how. #MarTech #DigitalMarketing

No comment yet.
Scooped by Marteq
Scoop.it!

8 Helpful Resources for Creating Beautiful Infographics - HubSpot

8 Helpful Resources for Creating Beautiful Infographics - HubSpot | The MarTech Digest | Scoop.it
1) Canva

2) Piktochart

3) Venngage

4) Easel.ly

5) Freepik

6) Infogram

7) Zanifesto

8) Google Charts
Marteq's insight:

Canva...say no more.


Email your comments to joe_rizzo@marketingIO.com. I’ll publish it here. marketingIO: One Source for All Marketing Technology Challenges. See our solutions.  

No comment yet.
Scooped by Marteq
Scoop.it!

Why Infographics Are A Core of Any SEO Strategy | MarTech

Why Infographics Are A Core of Any SEO Strategy | MarTech | The MarTech Digest | Scoop.it
Why Infographics Are A Core of Any SEO Strategy by Douglas Karr on MarTech
Marteq's insight:

Email your comments to joe@marketingIO.com. I’ll publish it here. marketingIO: One Source for All Marketing Technology Challenges. See our solutions.  

No comment yet.
Scooped by Marteq
Scoop.it!

The Five Best Infographic Creation Tools and Services - Webbiquity

The Five Best Infographic Creation Tools and Services - Webbiquity | The MarTech Digest | Scoop.it
1) Piktochart

2) Infogram

3) easel.ly

4) Venngage

5) Visual.ly
Marteq's insight:

CT for descriptions, pricing and links.


NEW: Experience Remarkable Planning Accuracy With New, FREE Growth Hacking Tool. Go here: http://goo.gl/UjcA8x  

No comment yet.
Scooped by Marteq
Scoop.it!

The Science Behind the Most Popular Infographics [Infographic] - Profs

The Science Behind the Most Popular Infographics [Infographic] - Profs | The MarTech Digest | Scoop.it
Content - Planning to use infographics in your marketing? Then check out what characteristics the most popular infographics have in common.
Marteq's insight:

marketingIO: One Source for All Marketing Technology Challenges. See our solutions.  

No comment yet.
Scooped by Marteq
Scoop.it!

A (Meta) Infographic about Infographics - Unbounce

A (Meta) Infographic about Infographics - Unbounce | The MarTech Digest | Scoop.it
Infographics are easy to digest and even easier to share — which is why people love them. But if you're going to put effort into making one, you want to be sure you're getting more bang for your buck. What better way to learn about awesome infographics than with an awesome infographic?
Marteq's insight:

A coffee table book about coffee tables...


marketingIO: One Source for All Marketing Technology Challenges. See our solutions.  

No comment yet.
Scooped by Marteq
Scoop.it!

25 Infographic Templates and Vector Kits to Help You Design Your Own Infographic - CopyPress

25 Infographic Templates and Vector Kits to Help You Design Your Own Infographic - CopyPress | The MarTech Digest | Scoop.it

marketingIO: One Source for All Marketing Technology Challenges. See our solutions

Marteq's insight:

Excellent collection of tools when you click through.

No comment yet.
Scooped by Marteq
Scoop.it!

The Infographic Design Cheat Sheet: 5 Layouts That'll Make Your Life Easier [Free Templates] - HubSpot

The Infographic Design Cheat Sheet: 5 Layouts That'll Make Your Life Easier [Free Templates] - HubSpot | The MarTech Digest | Scoop.it

marketingIO: One Source for All Marketing Technology Challenges. See our solutions

No comment yet.
Scooped by Marteq
Scoop.it!

The 6-Step Process to Creating a Free Infographic [Using Canva] - Visual Contenting

The 6-Step Process to Creating a Free Infographic [Using Canva] - Visual Contenting | The MarTech Digest | Scoop.it
Creating a Free Infographic Using Canva with 6 Easy Steps via visualcontenting.com


marketingIO: One Source for All Marketing Technology Challenges. See our solutions.

Marteq's insight:

It's true: Canva makes it incredibly easy to create an infographic. Having said that, you'll need to take that information and visualize it using Canva; that's a missing step in this infographic.

No comment yet.
Scooped by Marteq
Scoop.it!

Seven Tools for Creating Infographics Without Using Photoshop - Profs

Seven Tools for Creating Infographics Without Using Photoshop - Profs | The MarTech Digest | Scoop.it

Not having a fun time with IT? Contact us: we can act as your buffer to get the job done.

Marteq's insight:

Canva...hands-down.

No comment yet.
Scooped by Marteq
Scoop.it!

What Killed The Infographic? - Co.Design

What Killed The Infographic? - Co.Design | The MarTech Digest | Scoop.it
Infographics, it seems, are a dying breed. Except that in talking to a dozen data visualization experts across the world's top studios, I learned that the story is far more nuanced. Once a playground for independent designers, data visualization has evolved into something more mature, corporate, and honest about its failings. The quirky, experimental infographics that once peppered the Internet may be disappearing. But that's only because data visualization, as a medium, has finally grown up and gotten a job.
Just a few years ago, data visualization designers had to custom-code and design their projects—an exhaustive process which required building each visual like its own app. Today, a slew of new software has made it easier than ever to create data visualizations from scratch. The downside? It has led to more prescriptive design.

Five years ago, data visualizations were designed largely to be viewed on desktop computers. Today, smartphones and tablets represent roughly 50% of the web’s traffic. That’s a huge chunk of Internet mindshare that a sprawling, ambitious data visualization would be wasted on. So now, simple bar graphs, such as the ones you see on the business news site Quartz, often make more sense to publish than deep interactive content.

A dirty little secret about data visualization is that it doesn't always provide as much insight into large datasets as you might hope. The very medium of data-rich infographics might not be right for general consumers.


iNeoMarketing.com bridges the gap between your MarTech and your in-house experience. Contact us.

Marteq's insight:

The greatest killer of infographics? The small-screen I/O device.

No comment yet.
Scooped by Marteq
Scoop.it!

13 Reasons Why Your Brain Craves Infographics - NeoMam Studios

13 Reasons Why Your Brain Craves Infographics - NeoMam Studios | The MarTech Digest | Scoop.it

iNeoMarketing’s MarTech Managed Services drives more leads faster. Contact us to see how.

Marteq's insight:

The increase in the use of infographics has been overwhelming, for all the reasons above PLUS companies are getting smarter about their usage.

No comment yet.
Scooped by Marteq
Scoop.it!

5 Infographic Templates in PowerPoint [Free Download] - WordStream

5 Infographic Templates in PowerPoint [Free Download] - WordStream | The MarTech Digest | Scoop.it
Infographics are a powerful tool for capturing the attention of your target audiences. In fact, businesses that publish infographics grow their traffic an average of 12% more than those that don’t.

That’s why we’ve partnered with Hubspot to bring you these 5 customizable infographic templates that will give you the inspiration and foundation you need to build your own infographics right in PowerPoint.


Receive a FREE daily summary of The Marketing Technology Alert

Marteq's insight:

Behind a registration form.

No comment yet.
Scooped by Marteq
Scoop.it!

10 Reasons Why Infographics Are Useful to SEO and Digital Marketing [Infographic] - B2B Infographic

10 Reasons Why Infographics Are Useful to SEO and Digital Marketing [Infographic] - B2B Infographic | The MarTech Digest | Scoop.it
10 Reasons Why Infographics Are Useful to SEO and Digital Marketing


Receive a FREE daily summary of The Marketing Technology Alert

Pamphyl Kapaya Pambi's curator insight, January 6, 2015 4:05 PM

Edmonton SEO

Milena Mitova's curator insight, January 8, 2015 11:30 AM

Are Infographics really that popular? I find presentations far easier to interact with...

Rob Swick's curator insight, January 11, 2015 9:19 PM

Visual information is popular. People search for it, link to it, and share it.

Scooped by Marteq
Scoop.it!

The Secrets Of A Memorable Infographic - Fast Company

The Secrets Of A Memorable Infographic - Fast Company | The MarTech Digest | Scoop.it

Excerpt...


"The most memorable visualizations, by far, contained elements that fell under the category of "human recognizable objects." These were images with photographs, body parts, icons—things that people regularly encounter in their daily lives. "Human recognizable objects will instantly make it more memorable," says Doctoral student Michelle Borkin of Harvard's School of Engineering and Applied Sciences. All but one of the 12 most memorable images in the study had a recognizable component.


Beyond that, Borkin and company discovered a few secrets to infographic success. Color was key; visualizations with more than six colors were much more memorable than those with only a few colors or a black-and-white gradient. Visual density—what some of us might call "clutter"—wasn't a bad thing either. In fact, images with a lot going on were significantly more memorable than minimalist approaches. Roundness was another hallmark of memorability (after all, our brains do love curves).


On the contrary, basic bar graphs and charts were easy to forget. That surprised Borkin at first, who thought these visualizations might be memorable because people become familiar with them at an early age. Instead, they proved too similar to distinguish, eliciting a high false-alarm rate—meaning study participants thought they'd seen already them when they had not. As Borkin and her collaborators put it: "all the bar charts look alike.""


Receive a FREE daily summary of The Marketing Technology Alert

Marteq's insight:

SCIENCE!! Now you have some data to back up your design direction. Feel free to now conquer the world. Or your infographics.

PitchWorx's comment, December 4, 2014 6:22 AM
It is really nice . . .
Scooped by Marteq
Scoop.it!

Get your Infograph kick with our Free Infographic Elements Kit - WebHostFace

Get your Infograph kick with our Free Infographic Elements Kit - WebHostFace | The MarTech Digest | Scoop.it
Free Infographic Elements: Free vector specially created for you to start fiddling around and build your own infographics. Get your Infograph kick!


Receive a FREE daily summary of The Marketing Technology Alert

Marteq's insight:

Basic elements in an .eps file.

No comment yet.
Scooped by Marteq
Scoop.it!

Top 40 Free Infographics Submission Sites - B2B Infographic

__________________

Receive a FREE daily summary of The Marketing Technology Alert directly to your inbox. To subscribe, please go to http://ineomarketing.com/About_The_MAR_Sub.html  (your privacy is protected).

No comment yet.
Scooped by Marteq
Scoop.it!

Does Infographic Marketing Still Work? A Data Driven Answer - QuickSprout

Does Infographic Marketing Still Work? A Data Driven Answer - QuickSprout | The MarTech Digest | Scoop.it

Excerpt...


Although the data doesn’t look as appealing as it used to, if I were you, I would still continue to leverage infographics for the following 3 reasons:

-- >  They still produce good traffic – unless you are an exceptionally good writer, chances are you are going to generate more traffic from infographics than you will from your blog posts.

-- >  It helps with branding – more people will see your brand, assuming you put your logo on your infographics. This will help increase the amount of direct traffic you receive.

-- >  You’ll get great referral traffic – if it weren’t for infographics, I would have never generated links from sites like Forbes and Huffington Post. Sure, these links may not help boost your rankings as much as they did in the past, but they still drive qualified traffic to your site.


__________________

Receive a FREE daily summary of The Marketing Technology Alert directly to your inbox. To subscribe, please go to http://ineomarketing.com/About_The_MAR_Sub.html  (your privacy is protected).


Marteq's insight:

Infographics continue to play a role in the B2B visual marketing area. Don't discount!

Brandon Gains's curator insight, August 19, 2014 1:53 PM

Check out the Referral SaaSquatch blog for more Product Marketing Content! www.referralsaasquatch.com/blog

Scooped by Marteq
Scoop.it!

Make More Persuasive Infographics By Balancing Context With Simplicity - Forrester

Make More Persuasive Infographics By Balancing Context With Simplicity - Forrester | The MarTech Digest | Scoop.it

__________________

Receive a FREE daily summary of The Marketing Technology Alert directly to your inbox. To subscribe, please go to http://ineomarketing.com/About_The_MAR_Sub.html  (your privacy is protected).


No comment yet.
Scooped by Marteq
Scoop.it!

Tips for Sharing Your Infographic on Facebook, Twitter, Pinterest and Linkedin [Infographic] - Social Media Writing

Tips for Sharing Your Infographic on Facebook, Twitter, Pinterest and Linkedin [Infographic] - Social Media Writing | The MarTech Digest | Scoop.it

__________________________

Receive a FREE daily summary of The Marketing Technology Alert directly to your inbox. To subscribe, please go to http://ineomarketing.com/About_The_MAR_Sub.html  (your privacy is protected).


No comment yet.
Scooped by Marteq
Scoop.it!

How to Create an Infographic That Boosts Social Shares and Leads | Social Media Examiner | #TheMarketingTechAlert

How to Create an Infographic That Boosts Social Shares and Leads | Social Media Examiner | #TheMarketingTechAlert | The MarTech Digest | Scoop.it

Basic/ Digest...


If you want that attention on your marketing message, you’ll have to do more than share a picture surrounded by text. Here are seven steps to creating your first infographic.

#1: Plan Your Story Around Your Objectives

#2: Gather Your Data

#3: Sketch Your Idea

#4: Find Your Inspiration: Whether you have an infographic design in mind or not, it’s a good idea to look at what’s already out there (even if it’s just to ensure your idea is different enough to capture attention).

#5: Build Your Infographic

#6: Create Your Infographic’s Social Preview

#7: Share Your Infographic


____________________________________________________

Receive a FREE daily summary of The Marketing Technology Alert directly to your inbox. To subscribe, please go to http://ineomarketing.com/About_The_MAR_Sub.html  (your privacy is protected).


Marteq's insight:

Seems like a simple task, but it's numbers 1 and 2 that will require some quiet time to accomplish. And sometimes #2 comes before #1.

No comment yet.
Scooped by Marteq
Scoop.it!

4 Free Tools to Create Infographics #Online Marketer's Tool Kit - GetResponse Blog | #TheMarketingTechAlert

4 Free Tools to Create Infographics #Online Marketer's Tool Kit - GetResponse Blog | #TheMarketingTechAlert | The MarTech Digest | Scoop.it
You don't need to hire a graphic designer to publish great looking infographics - these 4 tools will do the job for you.


Basic/ Condensed...


Canva.com

If you are looking for a cheap (or free) design tool anyone can use effectively – here it is.

In my opinion it’s the most convenient free design tool. The interface is very intuitive and user-friendly, which is combined with a large number of various templates and images.


Easel.ly

When you’re just getting started with infographics – which is quite possible if you’re reading this post – this tool will give you great basis for creating your first infographic.


infogr.am

Entering the service will take you just seconds – all you have to do is log in using one of your social network profiles. Off you go to your first infographic!


Venngage.com

This tool certainly won’t amaze you at first sight – the layout and interface are not as impressive as those of the competitors. Still, it’s worth looking into – you’ll definitely be satisfied with the variation of templates and images to choose from. Pick and mix any images, icons and logos you wish.


____________________________________________________

Receive a FREE daily summary of The Marketing Technology Alert directly to your inbox. To subscribe, please go to http://ineomarketing.com/About_The_MAR_Sub.html  (your privacy is protected).

Marteq's insight:

As you get more proficient with your infographics, then you'll want to consider a professional service. Regardless, you know the value of visual content.

No comment yet.
Scooped by Marteq
Scoop.it!

Create Killer Infographics on Any Budget - Vocus | #TheMarketingTechAlert

Create Killer Infographics on Any Budget - Vocus | #TheMarketingTechAlert | The MarTech Digest | Scoop.it
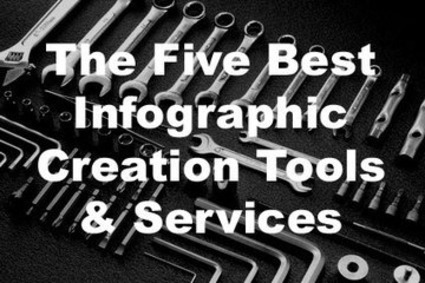
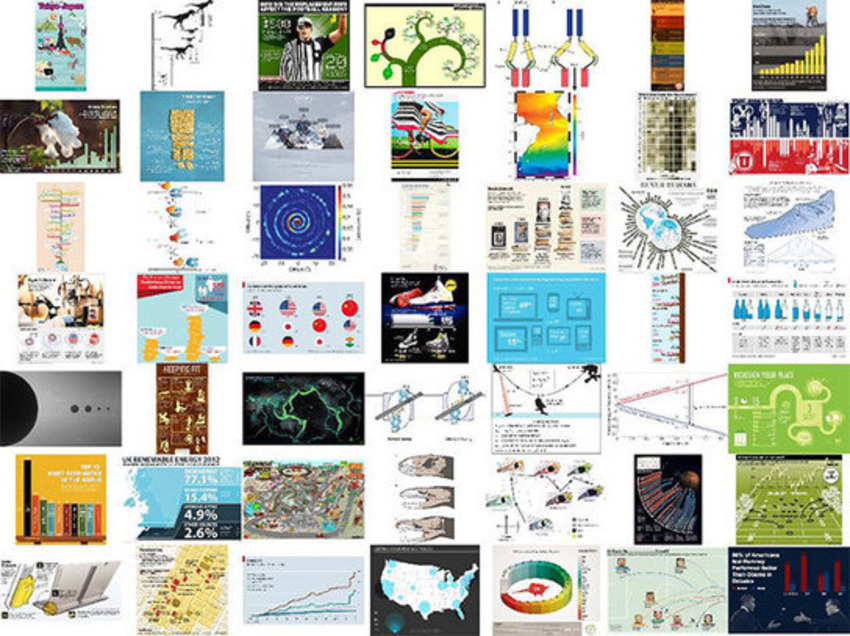
Infographics drive traffic, but are very expensive? See how to create infographics on any budget and the proper ways to distribute them for maximum results.


Basic/ Excerpt...


The first option (and probably the most expensive) is to hire a freelance designer to create one for you. Many designers specialize in infographics, or you could find one on a website such as freelancer.com, elance.com, ospring.com or others. Oftentimes on a site such as visual.ly you can see the designer’s name, enabling you to research their past work and see if they fit your vision.


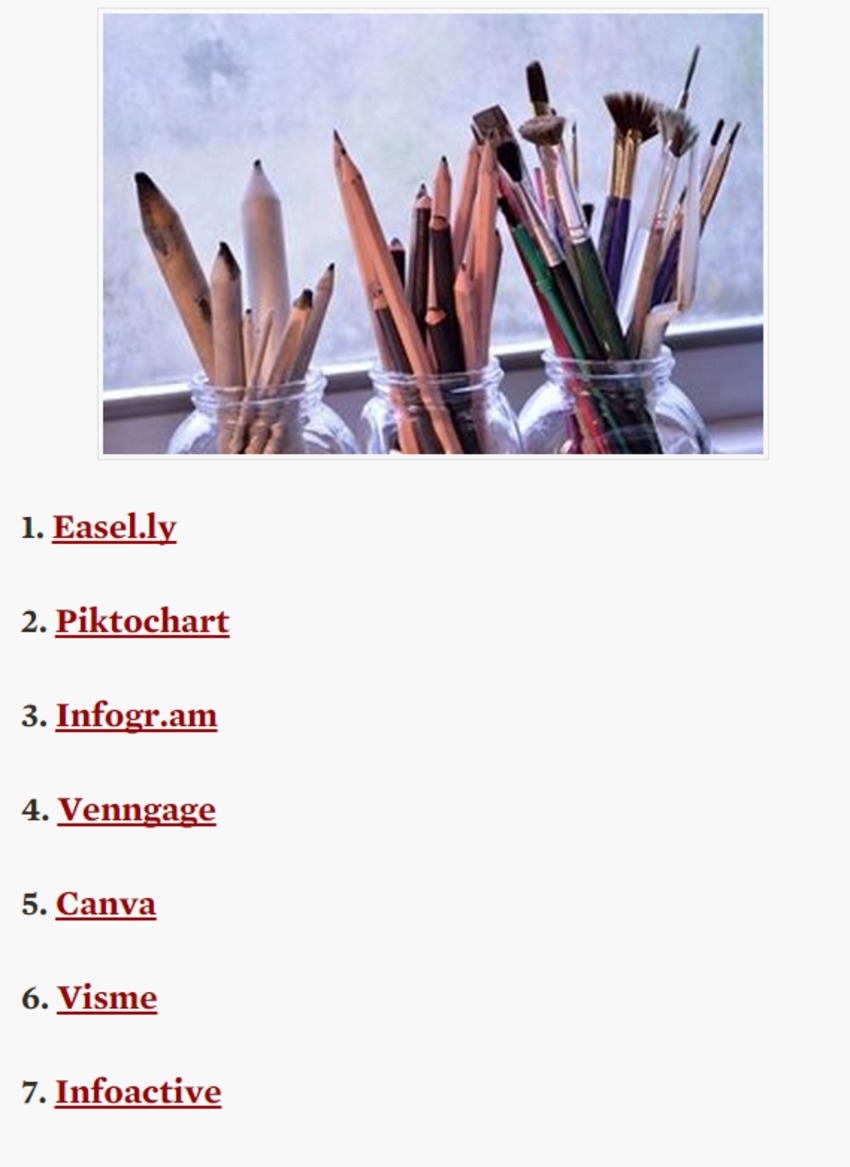
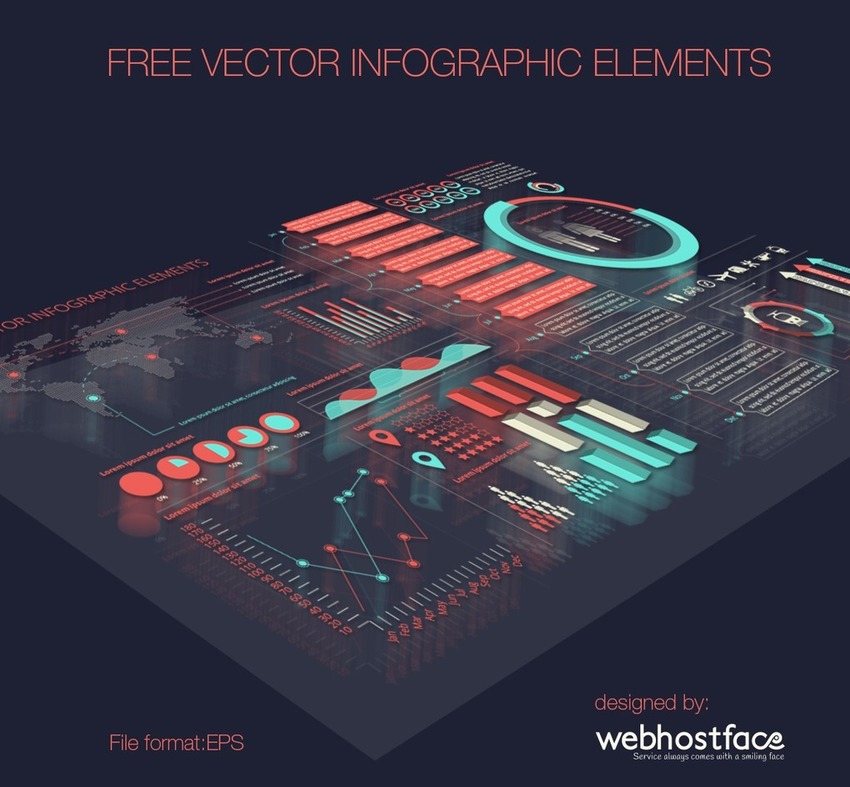
The second option of course is to create your own infographics. Enclosed below is a list of sites where you can do this, including the range of fees to use the service.

Canva – free to unknown licensing fee.

Easel.ly – free (currently in beta).

Gliffy – free to $7.99 / month.

iCharts – free to $75 / month.

Infoactive – free (currently in beta).

Infogram – free to $18 / month.

Photoshop – $9.99 / month.

Piktochart - free to $29 / month.

Presenter – free to $22 / month.

Tableau Premium – free to $500 per year.

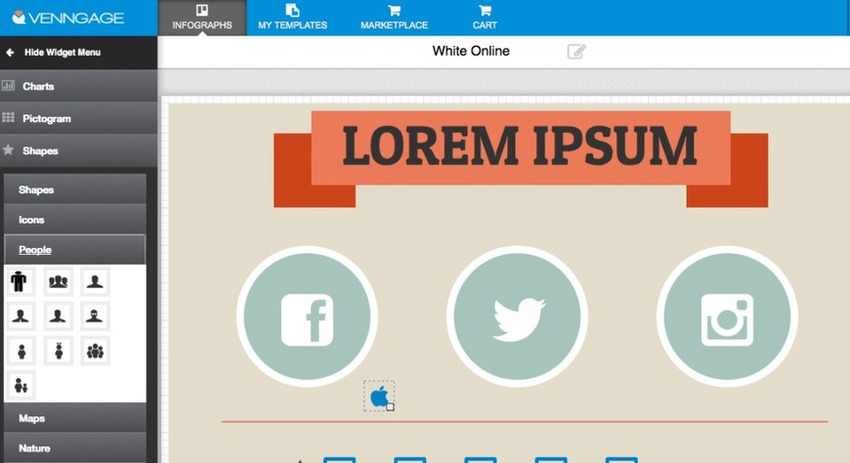
Venngage – free to $19 / month.


____________________________________________________

FREE: AgileContent™ delivers more quality content to your market! Get your FREE 14 Day Trial NOW!: http://goo.gl/rzeg79. No credit card required!


Receive a FREE daily summary of The Marketing Technology Alert directly to your inbox. To subscribe, please go to http://ineomarketing.com/About_The_MAR_Sub.html  (your privacy is protected).

Marteq's insight:

Another valuable post where the author does the research for you. And infographics are one of the most shareable assets.

No comment yet.
Scooped by Marteq
Scoop.it!

Salesforce: Your Automated Year in Review Infographic - Marketing Technology Blog

Salesforce: Your Automated Year in Review Infographic - Marketing Technology Blog | The MarTech Digest | Scoop.it
Salesforce: Your Automated Year in Review Infographic by Douglas Karr on Marketing Technology Blog


Excerpt...


As we’re working with clients, we often build out interactive tools to engage site visitors. This personalized Salesforce Infographic from ToutApp is simply too cool to not share! Just login with your Salesforce credentials and get a personalized report showing you trends and unique insights into your Salesforce Opportunities from 2013.


Read more: Salesforce: Your Automated Year in Review Infographic | Marketing Technology Blog http://www.marketingtechblog.com/salesforce-year-in-review/#ixzz2p0eJE2um
Under Creative Commons License: Attribution
Follow us: @mktgtechblog on Twitter | marketingtechnology on Facebook


___________________________________

Receive a FREE daily summary of The Marketing Technology Alert directly to your inbox. To subscribe, please go to http://ineomarketing.com/About_The_MAR_Sub.html  (your privacy is protected).

Marteq's insight:

This is great stuff. A no brainer!

No comment yet.
Scooped by Marteq
Scoop.it!

7 Superpowers of a Knockout Infographic - How to Get More Shares and Drive Traffic | Socially Sorted | #TheMarketingAutomationAlert

7 Superpowers of a Knockout Infographic - How to Get More Shares and Drive Traffic | Socially Sorted | #TheMarketingAutomationAlert | The MarTech Digest | Scoop.it
This post shows shows how to create a knockout infographic that gets more shares and drives traffic by using 7 keys or "superpowers".


__________________________________

NEW: iNeoMarketing makes content marketing easy with the new Q8 Content. Q8 fills your content pipeline daily with relevant articles that your audience wants to read. Learn more and sign up for the beta program: http://www.Q8content.com.


Receive a FREE daily summary of The Marketing Technology Alert directly to your inbox. To subscribe, please go to http://ineomarketing.com/About_The_MAR_Sub.html  (your privacy is protected).

Marteq's insight:

The accompanying article goes into detail behind each step. h/t to http://www.digitalinformationworld.com.

No comment yet.