 Your new post is loading...

|
Scooped by
Marteq
|
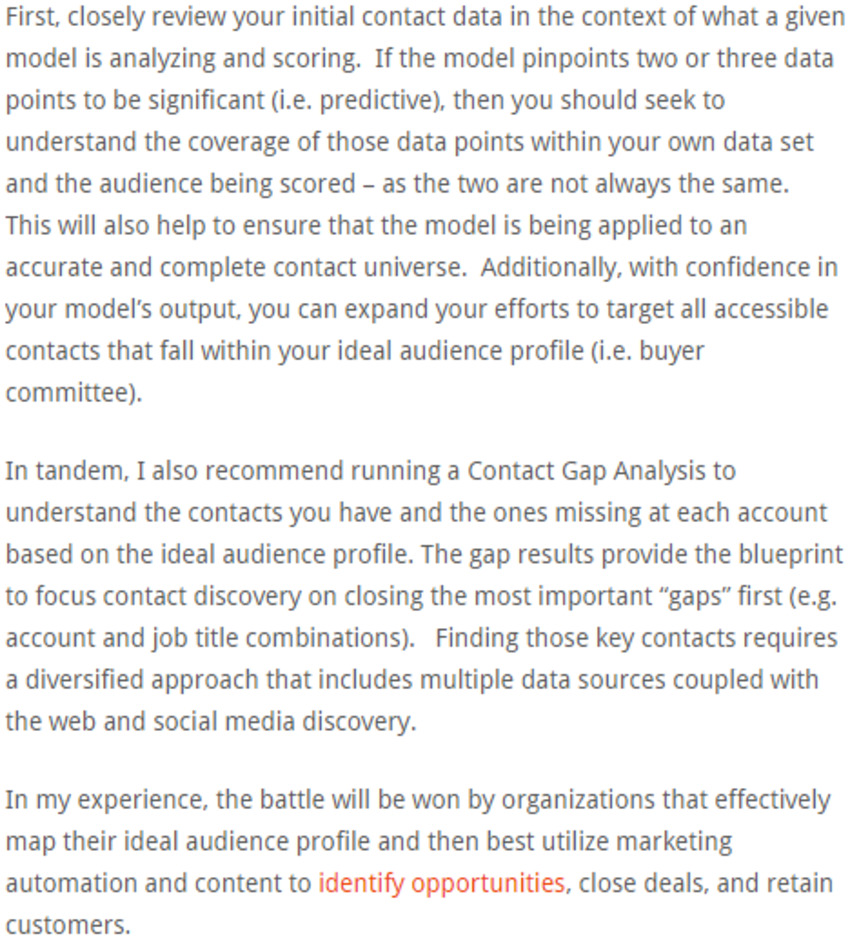
Companies believe they know their customers well because they’ve invested so much in gathering data. But consumers still feel like brands don’t know them as well as they should. That’s because there’s still data out there that companies haven’t captured, so the consumer feels like they’re not listening. Plus, even when companies do capture information, they don’t go the last mile to leverage that data and change the customer service experience. They don’t follow through in the application of the insight that they collect because there’s not enough feedback between the data stack and the marketing technology stack.
They’re overlooking certain pieces of data and therefore are not feeding them into their marketing technology stack. For example, our recent research shows that less than 50% of the companies we surveyed are using tools to analyze and implement social data, and that’s crucial.
|
|
Scooped by
Marteq
|
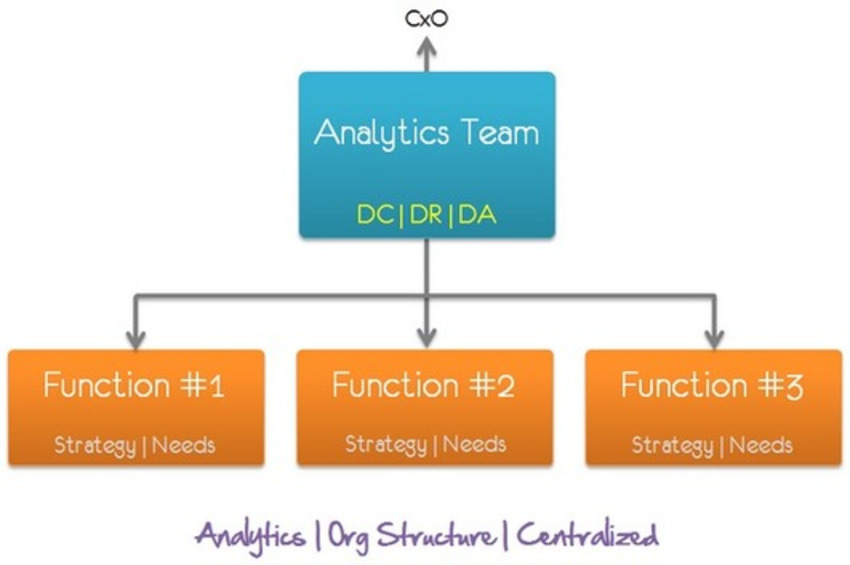
These analytics tools are broken into three primary categories:
Analytics platforms: Integrate and analyse data to uncover new insights. This is where the data science work is done and the tools vary from simple analysis to complex predictive modeling. These typically powerful, but generic technologies, deliver descriptive, diagnostic and predictive analytics telling us what happened, why it happened and what will happen next.
Analytics applications: Can go past generic analytics tools by being laser focused in a specific category or vertical. For example, a digital media optimization application will ingest and analyse the data. It will also provide descriptive, and diagnostic insights that go further by providing application-specific predictions of what will happen next and recommendations of how to respond – for instance where you should put your media funding).
Visualisation platforms: This is where the rubber hits the road in analytics. Specifically designed - as the name might suggest - for visualising data; taking complex data and presenting it in intuitive, simple-to-read visual formats that illuminate the information. The goal is to simplify the process and let an impactful dashboard - or visual - tell the story. Similar to analytics platforms, there are generic and application-specific visualisation platforms. Application-specific visualisation platforms go well beyond generic tools by providing ready-to-go visualisation packages specific to the application; saving months of development time.
|
|
Scooped by
Marteq
|
Not every company can afford to have full-time people dedicated to analysis. Hence let me make optimal recommendations for three types of companies.
If you are a handful of employees small business, here's your balance between data capture, data reporting, data analysis: 05 | 20 | 25.
You are a small business, I get it, you only have a part of one resource dedicated to data. No problem. Ensure that part-time resource is spending their time with a 05 | 20 | 25 balance. At your size, you'll still win with data.
If you are a numerous employees medium sized business that is growing at a ferocious pace, here's your DC | DR | DA balance: 10 | 25 | 65.
Lastly, if you are a massive employees corporation here's your DC | DR | DA balance: 15 | 35 | 50.
|
|
Scooped by
Marteq
|
Epiphany #1: Large sample sizes dilute eccentricity
Epiphany #2: P-values are trade-offs between certainty and experiment length
Epiphany #3: Small differences in conversion rates are near impossible to detect. Large ones, trivial.
Epiphany #4: You destroy a test’s validity by pulling the plug before its preordained test-duration has passed
Epiphany #5: “Relative” improvement matters, not “absolute” improvement
Epiphany #6: “Statistically insignificant” does not imply that the opposite result is true
Epiphany #7: Any tests that are run consecutively rather than in parallel will give bogus results
|
|
Scooped by
Marteq
|
Marketing Strategy - B2B marketers say the most important goal of their data management strategy is to improve ROI measurability, according to recent research from Openprise and Ascend2.
|
|
Scooped by
Marteq
|
A 2015 survey of more than 100 advertisers by the Interactive Advertising Bureau and the Winterberry Group found that only 34.8% of respondents in the survey said they have used data to help grow revenues. That’s about half the number that said growing revenues was one of the three most important objectives of using audience data.
A Forrester study also found that only 25% of data and analytics decision makers said their firms’ business intelligence investments have resulted in consumer satisfaction. And a third survey, from Iron Mountain and PwC, found that only 4% of businesses said they could extract full value from the data they have.
SocialCode recently conducted a survey with The CMO Club among 80 CMOs looking at how they used data. In particular, the report found 61% of respondents said they didn’t use digital advertising to identify new customer segments.
If marketers aren’t using data to identify new customer segments, what are they using it for? According to December 2014 research from eConsultancy, the most common uses for data were attribution and calculating lifetime customer value. marketingIO: One Source for All Marketing Technology Challenges. See our solutions.
|
|
Scooped by
Marteq
|
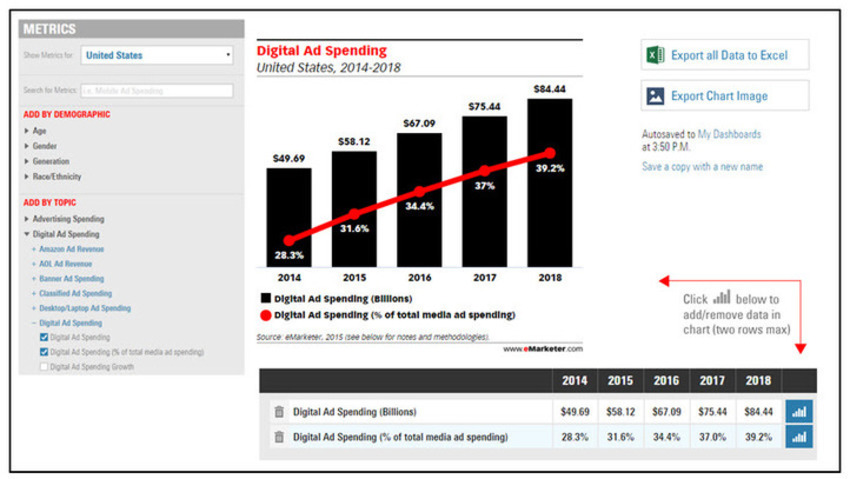
eMarketer announces the launch of Numbers, a customizable charting tool that allows users to tell compelling data stories quickly and easily. The new tool, which launches today, allows eMarketer customers to select from thousands of metrics to create charts and tables tailored for their specific needs. As with all eMarketer products, the Numbers tool incorporates only the most trusted, vetted, and methodically-researched eMarketer data.
Numbers charts can be custom-built using eMarketer’s vast database of research, which examines media trends, consumer behavior, and device usage in 41 countries. The Numbers tool also allows users to filter metrics by demographics, including age, generation, gender, and race.
With just a few clicks, users can select the metrics they want to visualize, and build a custom chart that tells their unique story with data. The information can then be used to track relevant trends by comparing benchmarks and metrics side by side. Once built, charts can be converted into PNG files or Excel spreadsheets with a simple click, enabling them to be downloaded and shared.
marketingIO: One Source for All Marketing Technology Challenges. See our solutions.
|
|
Scooped by
Marteq
|
Predictive Analytics is the next step in Marketing Automation. Contact us to see how.
|
|
Scooped by
Marteq
|
|
|
Scooped by
Marteq
|
"Some two-thirds of marketers currently use behavioral research (consumer behavior insights) to influence their marketing decisions, and almost 7 in 10 expect the use of behavioral data to grow over the next 3 years, according to a Millward Brown Digital study. Results from the survey also show that a majority are using audience measurement tools (61%), but that fewer have adopted marketing mix modeling (30%)."
Not having a fun time with IT? Contact us: we can act as your buffer to get the job done.
|
|
Scooped by
Marteq
|
|
|
Scooped by
Marteq
|
iNeoMarketing executes your revenue-generating efforts with the right metrics and the appropriate reports. Contact us to learn more.
|
|
Scooped by
Marteq
|
iNeoMarketing executes your revenue-generating efforts with the right metrics and the appropriate reports. Contact us to learn more.
|
|
Scooped by
Marteq
|
► About Us: iNeoMarketing provides Marketing Technology services, applications and support to B2B companies who do not have the required resources, knowledge or expertise. Visit us at ineomarketing.com. ◄
|
|
Scooped by
Marteq
|
Digest...
DON'T let fear or uncertainty stop you from starting today. DO learn the languages of analytics. DO combine your data with other data sets. DON'T think you can do it alone. DON'T expect the data to tell you everything you need to know about your customers. DO augment your data-driven insights via other types of intelligence such as qualitative and/or contextual research. DO tear down the walls to collaborate. DON'T forget it's a work in progress. DO be flexible. DON'T use the past to hold back future decisions. DO make data your friend not your enemy. ► Receive a FREE daily summary of The Marketing Technology Alert ◄
|
|
Scooped by
Marteq
|
|
|
Scooped by
Marteq
|
|
|
Scooped by
Marteq
|
|
|
Scooped by
Marteq
|
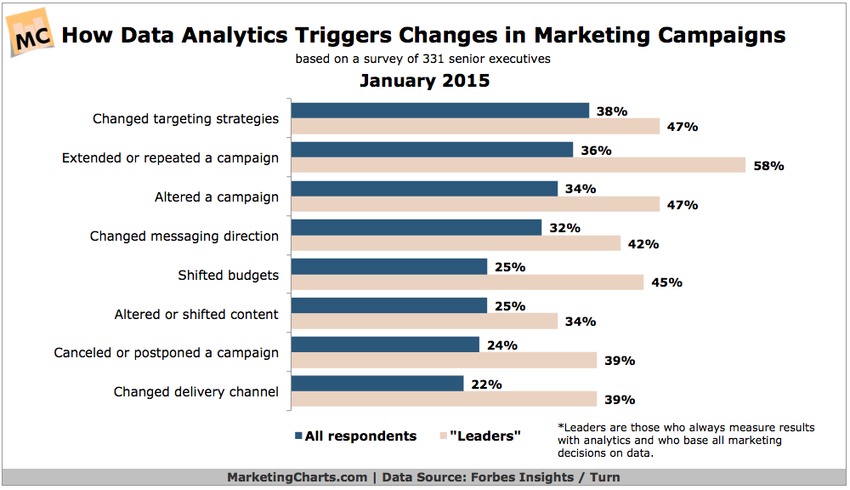
More than 7 in 10 executives believe that their reliance on data analytics for decision-making will either increase significantly (24%) or somewhat (47%) over the next 3 years, according to a report from Forbes Insights and Turn. Currently, data-driven marketing is credited by the largest share of respondents with creating competitive advantages in customer loyalty (47%), gaining new customers (43%) and customer satisfaction (42%). The most common changes within marketing campaigns triggered by data analytics are changed targeting strategies (38%), extending or repeating a campaign (36%) and altering a campaign (34%). For data-driven marketing “leaders” – 61% of whom note a measurable increase in ROI from data-driven campaigns – the biggest change triggered by data analytics is extending or repeating a campaign.
► Receive a FREE daily summary of The Marketing Technology Alert ◄
|
|
Scooped by
Marteq
|
To start leveraging your CRM data, take these key steps.
1. Target campaign to customers’ attributes: The more you know about what your customer “looks like” the more successful you’ll be. Dig into your CRM data to find trends in attributes including past purchases, affinities, demographics and other characteristics of your existing customers. As well as showing you which customers convert better, this enables cross-sell and up-sell opportunities.
Create a CRM segment of customers who purchased within the last seven days, and create offer “A” (an extended warranty, maybe). For another segment who purchased more than six months ago, create offer “B.” Your CRM insights are now keeping you relevant, avoiding the risk of alienating customers through mistargeting.
2. Segment to Deliver Results: Onboard your CRM segments into your online marketing platform and deliver across multiple channels. You can run your custom campaigns across ad networks, social media and your own website, creating a consistent, personalized dialogue and customer experience. Use real-time analytics to see what is working or not.
3. Optimize and extend: Now, use your CRM data to extend your customer base. Take what you know about your high-performing customers, overlay it on third-party datasets, and build lookalike audiences of prospects who share your top customers’ attributes. If you know that a particular income level combined with ownership of a certain car model are top customer attributes, create a custom audience of prospects based on this. Compared to targeting a generic audience… well, as our research shows, there’s a league of difference.
4. Don’t forget to scrub that data: Make sure that your CRM is complete, up-to-date, and accurate. That means name, address, phone number and email at a minimum. Whether you interact with customers in-store or via call center, this information is essential for a personalized experience that makes customers feel valued. It also helps you quickly identify and spend time with high-value customers.
↓↓↓↓↓↓↓↓↓↓↓↓↓↓↓↓↓↓↓↓↓↓↓↓↓↓↓
Receive a FREE daily summary of The Marketing Technology Alert HERE ↑↑↑↑↑↑↑↑↑↑↑↑↑↑↑↑↑↑↑↑↑↑↑↑↑↑↑
|
|
Scooped by
Marteq
|
"Twitter and IBM have partnered to combine Twitter's firehose of social data with IBM's analytics in an effort to offer business solutions to marketers overwhelmed by social data.
The companies have joined forces to partner Twitter’s data with IBM’s analytics tools to better inform business decisions. Through the partnership, IBM and Twitter will offer a set of enterprise applications that analyze tweets based on geography, public biographical information, and the emotion expressed in the tweet. IBM also plans to train 10,000 employees to consult with businesses on the best use of Twitter data.
The new applications could improve marketers’ understanding of "affinity categories, purchase habits, purchase readiness, and more" "
↓↓↓↓↓↓↓↓↓↓↓↓↓↓↓↓↓↓↓↓↓↓↓↓↓↓↓
Receive a FREE daily summary of The Marketing Technology Alert HERE ↑↑↑↑↑↑↑↑↑↑↑↑↑↑↑↑↑↑↑↑↑↑↑↑↑↑↑
|
|
Scooped by
Marteq
|
Digest...
This seven step process is effective in developing a data strategy and plan that gets both approved and funded. - Elect a Captain
Gather a multi-functional team and elect a “data captain.” - Segment and sub-segment the market
The goal is to arrive at a clear view of the market segments, and then define each using data descriptors. - Determine needs vs. wants
Prioritize what data is really needed to execute vs. what everybody wants. - Identify data sources
Some data will only be available from internal sources, and some will be needed from outside vendors. Carefully research the most accurate and reliable outside data vendors and establish a relationship and costs with them. Be sure to also audit their data for accuracy and completeness. - Agree on data quality and accuracy standards
For each data element, agree on an acceptable level of accuracy and its value. Then establish the updating and cleaning processes in accordance with the value and accuracy standard. - Decide on internal vs. external database development
One good approach is to select a qualified B2B database service provider to develop the database with the understanding that eventually it will be transferred in-house. - Find quick, easy and/or important wins
Don’t go for a budget approval without first identifying projects and/or results that are quick, easy and/or important. __________________ ► Receive a FREE daily summary of The Marketing Technology Alert directly to your inbox. To subscribe, please go to http://ineomarketing.com/About_The_MAR_Sub.html (your privacy is protected).
|
|
Scooped by
Marteq
|
Digest...
Behavioral data Behavioral data enables you to measure how active your prospects are with your brand. Typical types of behaviors you likely have access to are website activity, event activity, and email activity. However, you can add in more data sources, such as product data and social engagement, to give you a complete view of where your prospects engage with you the most. External triggers External triggers allow marketers to understand the motivation behind user behavior. Behaviors stem from: - Motives—Why is the user interacting with your brand at all?
- Incentives—What is the user gaining?
Motives and incentives contribute to the overall action, which attributes to behavior. Sales data Sales data provides insights on who your target audience is and how customers found and used your product to meet their needs. Marketers must understand the likely buyers, who needs to get involved, what are the objections faced by your sales team, and—ultimately—how your marketing message resonates with customers. __________________ ► Receive a FREE daily summary of The Marketing Technology Alert directly to your inbox. To subscribe, please go to http://ineomarketing.com/About_The_MAR_Sub.html (your privacy is protected).
|
|
Scooped by
Marteq
|
Topline:
84% of marketing databases are barely functional. 88% of 61M+ records analyzed were lacking basic firmographic data. (industry, company revenue, number of employees) __________________________ ► Receive a FREE daily summary of The Marketing Technology Alert directly to your inbox. To subscribe, please go to http://ineomarketing.com/About_The_MAR_Sub.html (your privacy is protected).
|
|
Scooped by
Marteq
|
While advertisers have become incredibly datasavvy, the most difficult challenge remains causally linking that data to outcomes that really matter.
Advanced/ Excerpt...
Today, marketers face two roadblocks to implementing pervasive experimentation. The first is technological. Conducting experiments in digital channels is relatively easy—test and control groups can be created with cookies or mobile device identifiers and value creation can be measured on websites or through mobile applications. What's missing is the technology to automate the configuration and management of experiments at scale, including the ability to optimize to causal outcomes. The second roadblock is cultural. Marketers, agencies, platforms, and publishers all have vested interests in existing flawed measurement approaches. Changing to a new standard for measurement based on experimentation will take time. ____________________________________________________ ► Receive a FREE daily summary of The Marketing Technology Alert directly to your inbox. To subscribe, please go to http://ineomarketing.com/About_The_MAR_Sub.html (your privacy is protected).
|
|


![Only 14 Percent of Marketers Are Confident When It Comes to Data [Study] - ClickZ | The MarTech Digest | Scoop.it](https://img.scoop.it/85fbDSaq07paQM2OdhpZU_L6dadsvGA8m9WNoVsbzkY=)


![IAB: Marketers Eager to Optimize Data Tools [Study] - ClickZ | The MarTech Digest | Scoop.it](https://img.scoop.it/0LrbgwmjqbWMrFJ4fZhbD_L6dadsvGA8m9WNoVsbzkY=)


RYZZ: It’s a new approach to MarTech for B2B Marketers.
#MarTech #DigitalMarketing