The MarTech Digest
563.0K views | +0 today
Follow
Your new post is loading...
Scooped by Marteq
Scoop.it!

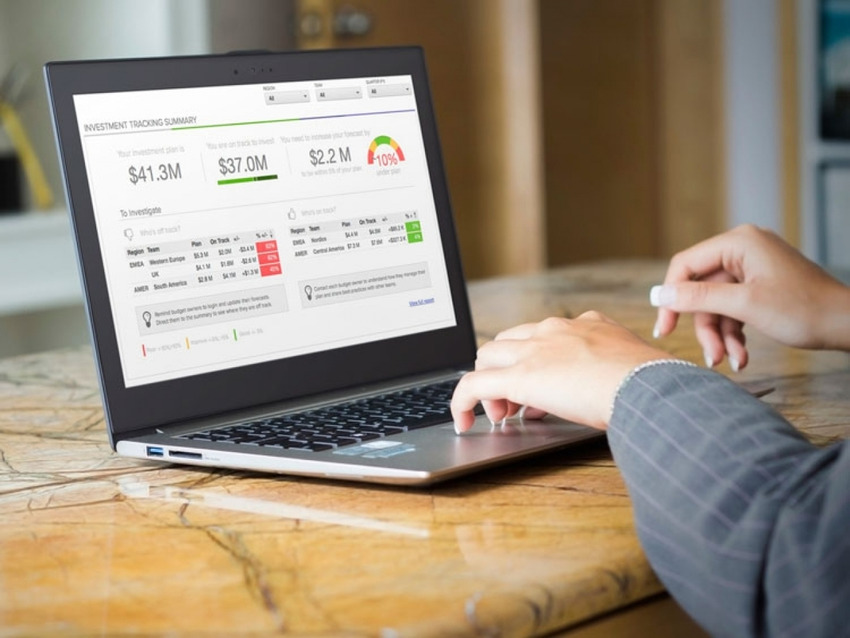
How to: 7 steps to building the ultimate CX dashboard - CMO.com

How to: 7 steps to building the ultimate CX dashboard - CMO.com | The MarTech Digest | Scoop.it
1. Start with a blueprint and know your audience


2. Make the dashboard relevant to your customer journey


3. Show the link to business outcomes  


4. Keep a close eye on performance management and data


5. Don’t turn all metrics into targets


6. Utility before beauty


7. Take accountability
Marteq's insight:

How to: 7 steps to building the ultimate CX dashboard - CMO.com


But what's missing is how to build the dashboard.


This news comes to you compliments of marketingIO.com. #MarTech #DigitalMarketing

No comment yet.
Scooped by Marteq
Scoop.it!

Five Tips for Building a Better CMO Dashboard - SiriusDecisions

Five Tips for Building a Better CMO Dashboard - SiriusDecisions | The MarTech Digest | Scoop.it

"Here are five basic tips for building an effective CMO dashboard:

  1. Know your audience. Start by understanding who the dashboard is for. Is it for the CMO to share marketing performance updates to the rest of the C-suite or the board of directors? Or is it for the CMO and marketing leadership to use in managing marketing functions? Knowing the audience for the dashboard helps focus its design, clarify the class and type of metrics to select, and determine the dimensional filters (e.g. industry, geography, product, campaign) that are required.
  2. Understand audience business questions. Understand what business questions the audience has, how these questions can be answered with dashboard data, and how frequently the information needs to be updated to stay relevant. 
  3. Tell a story. Dashboards need to tell a story, as measurement results and data points are not always intuitive or readily actionable to the intended audience. Use a logical presentation flow, as the most compelling view of marketing performance begins with the big picture, then connects with the actions marketing takes, and links to supporting data. 
  4. Use visualization effectively. 
  5. Weave in analysis and share insights. "
Marteq's insight:

Every CMO has (or should have) a dashboard, so you'll want to click through for the deeper detail. Smart advice.


Click/tap to view the original article.

This news comes to you compliments of marketingIO.com. #MarTech #DigitalMarketing

No comment yet.
Scooped by Marteq
Scoop.it!

Allocadia Launches Marketing Performance Dashboards - Demand Gen Report

Allocadia Launches Marketing Performance Dashboards - Demand Gen Report | The MarTech Digest | Scoop.it
Allocadia’s Marketing Performance Management (MPM) dashboards are designed to help marketers better understand where to invest their budget.

The company states that its MPM dashboards enable marketers and finance leaders to answer business questions such as:
  • Are the field marketing plans and budgets aligned with corporate goals?
  • Are we investing sufficiently in the right mix of programs and activities to achieve our stated business objectives?
  • What impact are my activities having on revenue, based on a range of attribution models?
Marteq's insight:

Visualize your Marketing Stack. marketingIO will analyze your marketing technology and deliver a visual of your MarTech Stack. Free. Go here.


marketingIO: MarTech for B2B Marketers. Strategy, Software, Services, Support, Staffing.  Go here to submit RFQs. #MarTech #DigitalMarketing

No comment yet.
Scooped by Marteq
Scoop.it!

Marketing Dashboards for Financial Services | SiriusDecisions

Marketing Dashboards for Financial Services | SiriusDecisions | The MarTech Digest | Scoop.it
  1. Know your audience. We recommend interviewing the stakeholders you are developing dashboards with to understand the insights they would find beneficial or the value they expect marketing to deliver. 
  2. Start with a summary. Save the reader time by summarizing the most recent data and placing it in context. 
  3. Pay attention to flow. The order of information presented in a dashboard should flow to better visualize cause and effect. We recommend that the presentation of data flow from activity to output to impact.
Marteq's insight:

Applies to all verticals!


marketingIO’s MarTech Managed Services drives more leads faster. Contact us to see how. #MarTech #DigitalMarketing

No comment yet.
Scooped by Marteq
Scoop.it!

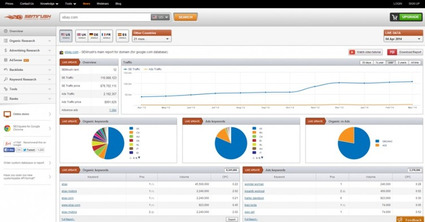
Top 6 Marketing Analytics Dashboard Tools - SEMRush

Top 6 Marketing Analytics Dashboard Tools - SEMRush | The MarTech Digest | Scoop.it
If you’re ready to streamline your digital marketing analytics process, check out these top six digital marketing analytics platforms for you and your business.

1. Cyfe

2. Mixpanel

3. Moz Pro

4. Kissmetrics

5. Hotjar

6. SEMrush
Marteq's insight:

NEW: Experience Remarkable Planning Accuracy With New, FREE Growth Hacking Tool. Go here: http://goo.gl/UjcA8x   

No comment yet.
Scooped by Marteq
Scoop.it!

Dashboards to Monitor Multiple Social Media Metrics: Social Media Examiner

Dashboards to Monitor Multiple Social Media Metrics: Social Media Examiner | The MarTech Digest | Scoop.it
Dasheroo

Dasheroo lets you create customized dashboards to view everything from Facebook and Twitter to Google Analytics and your email marketing metrics, all in one place. It integrates with more than 27 applications like Facebook, Twitter, Instagram, PayPal, SurveyMonkey, Google Analytics, and more.

Cyfe

Cyfe goes beyond social media to connect all of your marketing channels in one robust platform. Cyfe lets you use pre-built widgets for advertising, blogging, email, social media, SEO, and more. It natively integrates with 68 applications.

Klipfolio

With Klipfolio you get real-time access to your business metrics and analytics and can connect to all of the services you use every day. Starting at $24 per month for up to five users, it’s a great option for small- to medium-sized businesses.

Raven Tools

A great option for small- to medium-sized businesses, Raven Tools lets teams collaborate seamlessly on SEO, social, PPC, and content marketing campaigns all in one place. Reporting is easy and automated. With prices starting at $99 per month, it’s an affordable and effective option for campaign managing and reporting.
Marteq's insight:

And CT for how to integrate with the various channels.


NEW: Experience Remarkable Planning Accuracy With New, FREE Growth Hacking Tool. Go here: http://goo.gl/UjcA8x   

himanshi lamba 1's comment, September 6, 2016 2:40 AM
Really interesting post. Here I need to mention Klipfolio is an online dashboard platform for building powerful real-time business dashboards for the team to stay in control of the business by providing you the visibility into the most important data and metrics. Have a look at http://www.actiknow.com/klipfolio-2/
to get knowledge about this tool.
Scooped by Marteq
Scoop.it!

The ultimate list of Custom Dashboards and BI tools to Track your Metrics and Gather Insights - Blendo

The ultimate list of Custom Dashboards and BI tools to Track your Metrics and Gather Insights - Blendo | The MarTech Digest | Scoop.it
If you are a data analyst that wants to access your data with SQL check Mode Analytics and Periscope. for open source kind check Re:dash

If you need quick, useful and beautiful dashboards check Geckoboard and Geckoboard. Want to take it a bit further? Check Leftronic and Klipfolio.

Not an SQL-savvy user? Check Chartio

Are you a data analyst that wants to easily explore your data sets? Check Looker

Want to have the best visualizations? Check Tableau.
Marteq's insight:

NEW: Experience Remarkable Planning Accuracy With New, FREE Growth Hacking Tool. Go here: http://goo.gl/UjcA8x 

No comment yet.
Scooped by Marteq
Scoop.it!

5 Metrics to Track for Your Beginner Marketing Dashboard

5 Metrics to Track for Your Beginner Marketing Dashboard | The MarTech Digest | Scoop.it
As you setup your beginner marketing dashboard and begin to use it to your advantage, pay close attention to the following five metrics.

1. Email Marketing List Growth

2. Social Media Engagement

3. Google Analytics Users

4. Social Media Followers

5. Ecommerce
Marteq's insight:

That's if you're unclear as to your digital objectives.


marketingIO: One Source for All Marketing Technology Challenges. See our solutions.  

No comment yet.
Scooped by Marteq
Scoop.it!

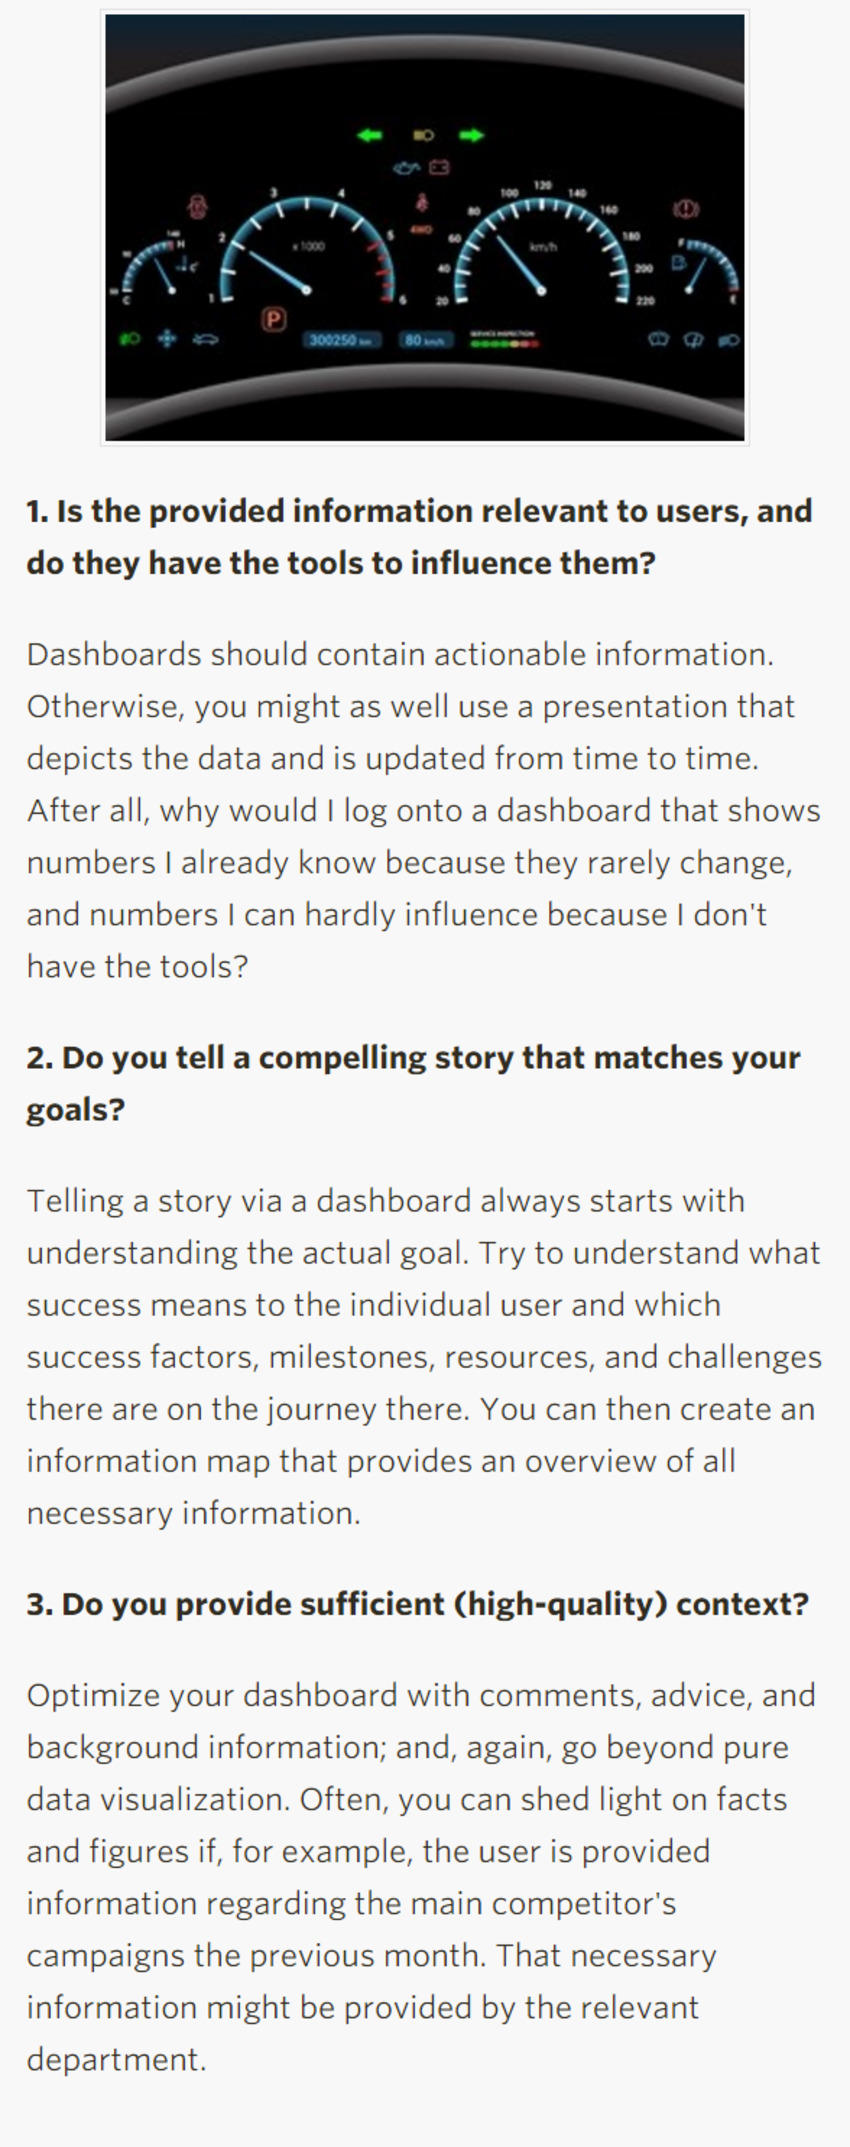
The Problem With Marketing Dashboards: Pure Data Visualization Is Rarely Successful - Profs

The Problem With Marketing Dashboards: Pure Data Visualization Is Rarely Successful - Profs | The MarTech Digest | Scoop.it

marketingIO: One Source for All Marketing Technology Challenges. See our solutions

Marteq's insight:

Smart advice for an almost-always difficult task.

No comment yet.
Scooped by Marteq
Scoop.it!

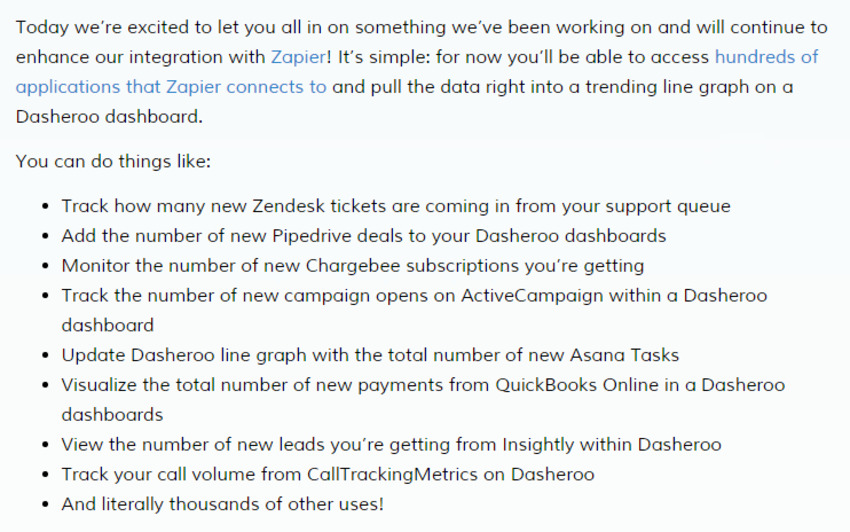
New Dasheroo Release: Zapier Gives You Hundreds of Apps for Your Dashboards

New Dasheroo Release: Zapier Gives You Hundreds of Apps for Your Dashboards | The MarTech Digest | Scoop.it

marketingIO: One Source for All Marketing Technology Challenges. See our solutions

No comment yet.
Scooped by Marteq
Scoop.it!

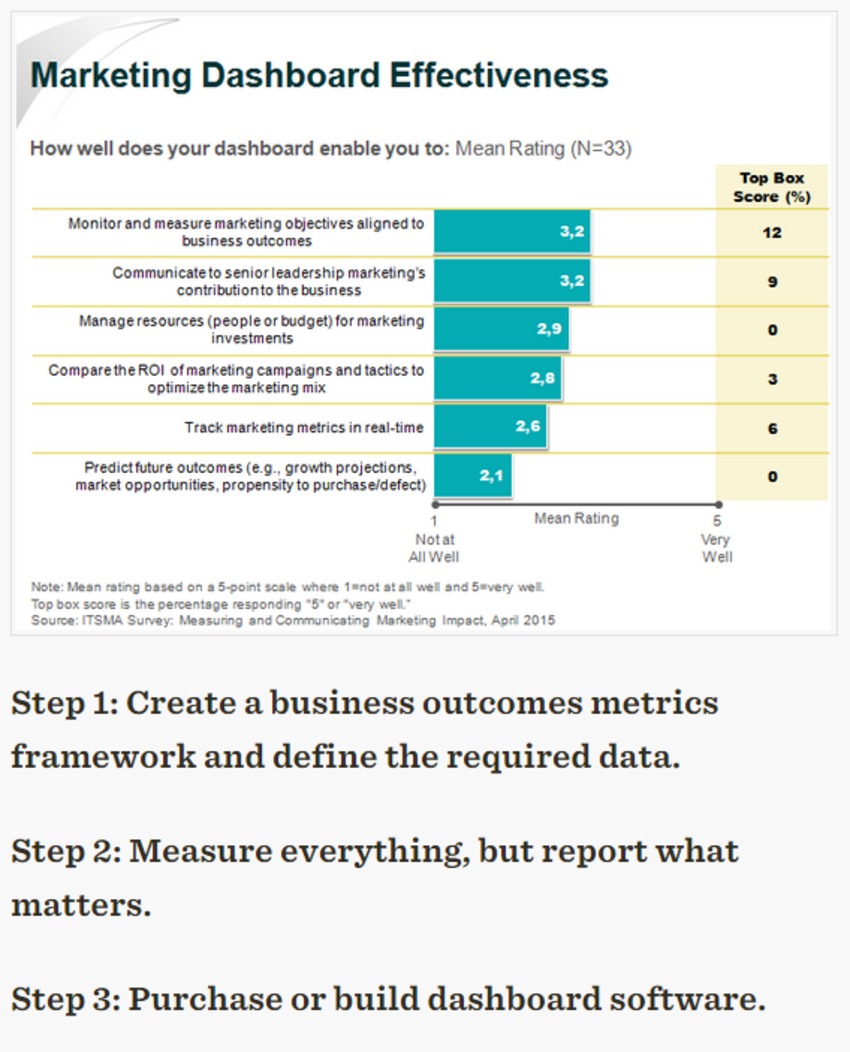
Research Highlight: Making Marketing Dashboards Meaningful – ITSMA

Research Highlight: Making Marketing Dashboards Meaningful – ITSMA | The MarTech Digest | Scoop.it

marketingIO executes your revenue-generating efforts with the right metrics and the appropriate reports. 

No comment yet.
Scooped by Marteq
Scoop.it!

The Marketing Dashboard Template for Content Metrics - Kapost

The Marketing Dashboard Template for Content Metrics - Kapost | The MarTech Digest | Scoop.it
Struggling to track the right metrics to determine content success? Get this marketing dashboard template to streamline your reporting and gain insight into the content that's driving results for your business. In this workbook, you'll find:

  • The most important metrics for determining the ROI of your B2B content
  • Charts for measuring success immediately, 120 days, 180 days, and 270 days out
  • Sample dashboards to get you started quickly
Ready to measure the success of your content metrics? Download your marketing dashboard template now.


iNeoMarketing’s Outsourcing delivers the vetted talent you need under your complete management and control. Contact us to see how.

Marteq's insight:

Behind a quick registration form.

LaMont Price's curator insight, July 31, 2015 3:31 PM

Behind a quick registration form.

Scooped by Marteq
Scoop.it!

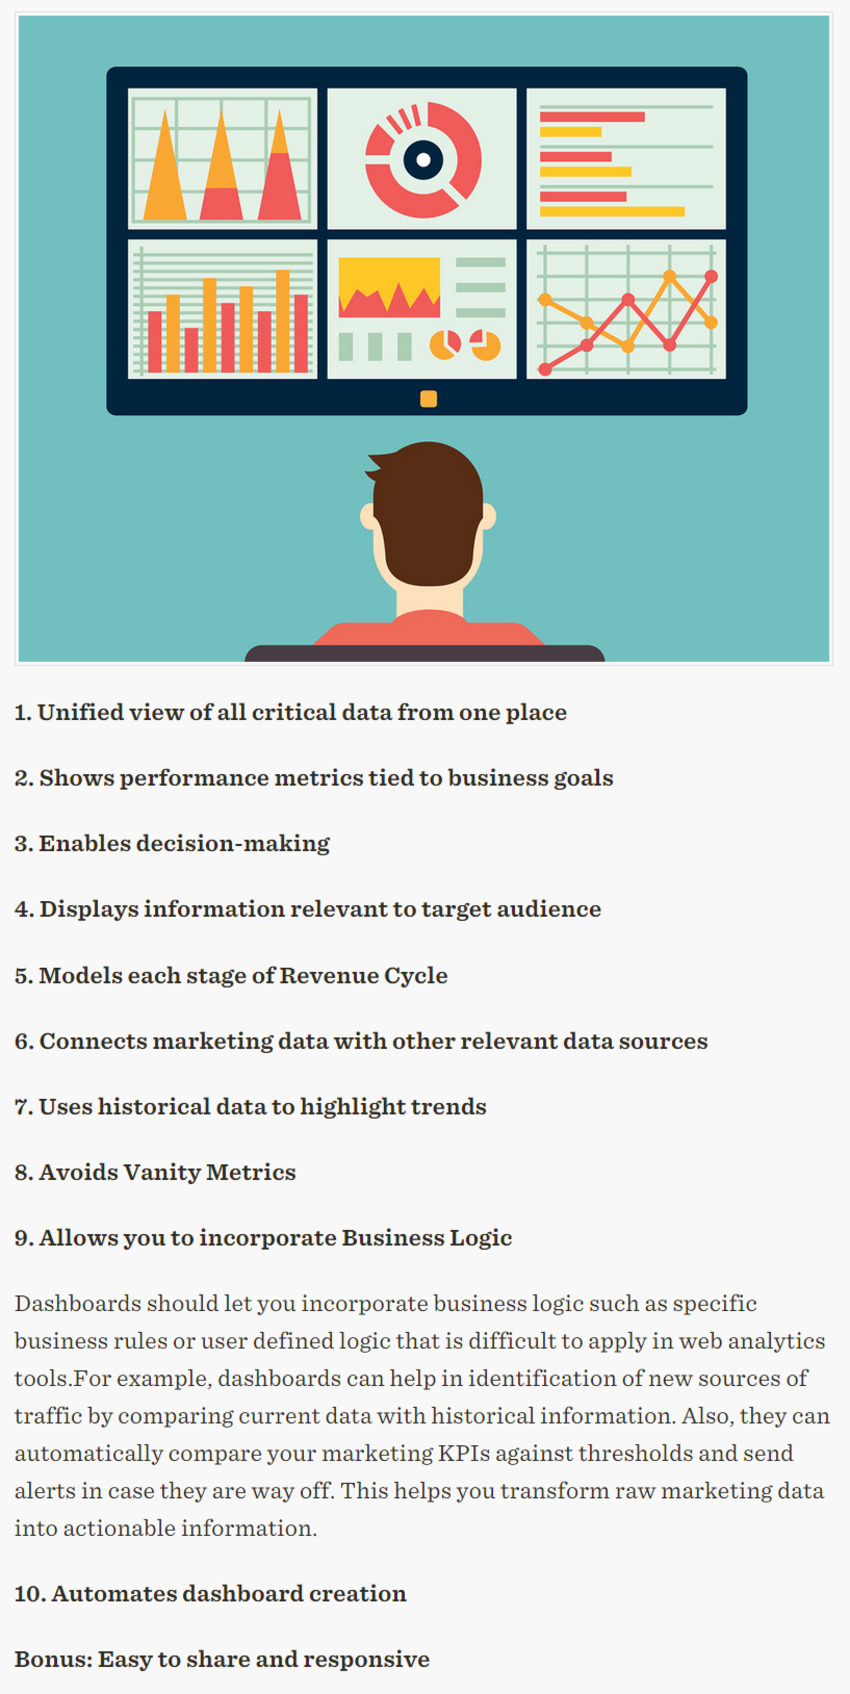
10 Criteria for Exceptional Marketing Dashboards - Inbound Marketing Agents

10 Criteria for Exceptional Marketing Dashboards - Inbound Marketing Agents | The MarTech Digest | Scoop.it

Let iNeoMarketing create a new approach for your inbound and outbound marketing…and realize more revenue. Contact us.

Marteq's insight:

A solid, definitive set of criteria for marketing dashboards. Very smart!

No comment yet.
Scooped by Marteq
Scoop.it!

Dashboards: Distilling Data Into Marketing Wisdom - CMO.com

Dashboards: Distilling Data Into Marketing Wisdom - CMO.com | The MarTech Digest | Scoop.it

Dashboards are hard, even with an all-inclusive cloud in place. Just as it is with anything else, it requires a plan, feedback, resources, a timeline, and testing...lots of testing.

Marteq's insight:

iNeoMarketing executes your revenue-generating efforts with the right metrics and the appropriate reports. Contact us to learn more.

No comment yet.
Scooped by Marteq
Scoop.it!

Keeping Score: The ART of ROI (Return on Innovation) Dashboards - Imaginatik

Presented by Luis Solis, President North America, Imaginatik at Chief Innovation Officer Summit, NY Dec. 2-3, 2014


â–ş Receive a FREE daily summary of The Marketing Technology Alert â—„

Marteq's insight:

Get through to slide 10+. A different perspective.

No comment yet.
Scooped by Marteq
Scoop.it!

Four essential steps to creating a B2B marketing dashboard - Econsultancy | #TheMarketingAutomationAlert

Four essential steps to creating a B2B marketing dashboard - Econsultancy | #TheMarketingAutomationAlert | The MarTech Digest | Scoop.it
If you follow marketing and digital related blogs and news sites, then it won’t come as a surprise to you that marketing professionals and CMOs are expected to show how activity achieves business results.


Condensed...


Inbound marketing

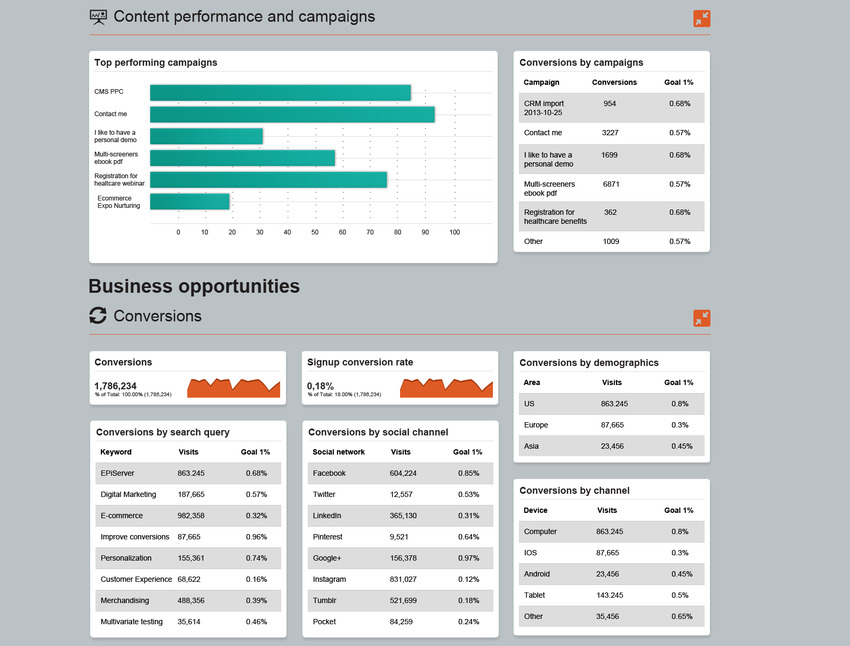
I have included general traffic stats, conversions by campaigns, conversions by demographics, conversions by social or mobile channels (inbound source). By building an understanding of how the visitor behaves, and how they engage with your organization early on in the funnel, you will be able to use the insight to improve your communication and personalize how you present content.


Content performance

In this sector of the dashboard, you can get more in depth in understanding the impact the content has on your business. Display your top performing campaigns and content pieces and make sure that the view can also display demographics so that you can get an instant snapshot of who is engaging with your content, and which content generates the highest number of marketing qualified leads (MQL).


Generated business opportunities

The basic instep covers the following metrics:  total number of leads, total number of anonymous and known leads and total number of marketing qualified leads.


Make sure that you can slice these by region and/or industry, all depending on how your sales organization is set up. The metrics should match the interest of the person looking at the dashboard.


The next step is qualification, so the data might not be 'owned' by you anymore, but you will still benefit from being able to show how many of your MQL leads became Sales Qualified Leads (SQL).


The final graph that I would add to this segment of the dashboard is marketing’s contribution to pipeline revenue and display this alongside total pipeline.


___________________________________

-Receive a FREE daily summary of The Marketing Technology Alert directly to your inbox. To subscribe, please go to http://ineomarketing.com/About_The_MAR_Sub.html  (your privacy is protected).

-If you like this scoop from The Marketing Technology Alert (brought to you by iNeoMarketing), PLEASE share by using the links below.

Marteq's insight:

Another practical guide to building a dashboard. I think we all understand that one's dashboard is unique, but you need to start somewhere, and this article provides a nice launching pad.

Corinne BILLON's curator insight, February 5, 2014 5:48 AM

Un peu de méthodo lorsque l'on part de ZERO !

Scooped by Marteq
Scoop.it!

Make a Great Marketing Dashboard | Lead Views - a B2B Lead Generation Blog

Make a Great Marketing Dashboard | Lead Views - a B2B Lead Generation Blog | The MarTech Digest | Scoop.it

In their entirety...


The following is a description of popular KPIs often found on marketing dashboards.

  • Conversion Metrics. This is a measure of campaign success. It’s defined typically as a ratio between the sum of reach-outs and visits to generated leads. In addition, the number of leads per channel can drive the allocation of resources to productive channels instead of ones that are not.
  • Return on Investment (ROI). This campaign measure looks at success as a function of the overall investment. The formula is (Attributable Revenue – Campaign Investment) / (Campaign Investment) over a particular period of time.
  • Incremental Sales. Each lead, win and failure has an impact on sales. The formula is Revenue Generated by Marketing Initiatives – Baseline Sales.
  • Funnel. Marketers love this KPI because they can track the movement of prospects through different funnel stages (live, active, marketing qualified, sales accepted, sales rejected, closed sales). Other useful metrics can be tacked on to provide additional insights, e.g., time to move to the next funnel stage or percentage of leads leaving the funnel at each stage.
  • Cost Per Lead. The formula is, very simply, Total Campaign Cost / Number of Leads Generated. Marketers use this to build a case for the expenditure of money and time. The overall goal is, of course, to minimize the cost per lead. If it’s too high, continuing the campaign cannot be justified.
  • Engagement. This is a measure of campaign performance based on the number of unique opens, clicks and generated leads. Marketers use these metrics to optimize campaigns by adjusting content and call-to-actions (CTAs) to engender prospect responses.
  • Social Media. This is the number of social media interactions over a period of time. Those interactions are defined as likes, retweets and +1s.
  • Traffic Sources. This metric presents breakdowns of traffic by category and sources. A marketer is always interested in understanding the contribution from each source and the growth/decrease over a specific time period. This metric will drive marketers to probe deeply when needed and optimize as required.
  • Organic Traffic. Instead of measuring organic traffic growth frequently, focus on the longer term picture, e.g., year-over-year (YOY) changes. This takes into account seasonality and provides a better overall measure of search engine optimization.
  • Referral Traffic Growth. This metric should cover changes in referral traffic and referral traffic sources. A marketer should be able to use this to make decisions about optimizing inbound marketing sources, including third-party websites (other than search engines), social media platforms and partner websites.
  • Cost-Per-Acquisition. This metric calculates CPA individually for each digital campaign and should reflect changes over the time period. This key metric for marketers is often used in management reporting to highlight the efficiency of marketing tactics.
Marteq's insight:

This is one of the better pieces of curated content that covers what you need for a marketing dashboard.


  • See the article at www.leadformix.com
  • Receive a daily summary of The Marketing Automation Alert directly to your inbox. Subscribe here (your privacy is protected).
  • If you like this scoop, PLEASE share by using the links below.
  • iNeoMarketing merges marketing automation with content marketing for a powerful lead management solution, configured and managed by our knowledgeable, experienced staff.  Contact us
Corinne BILLON's curator insight, February 5, 2014 5:45 AM

Vraiment intéressant. Pour les marketeurs

Scooped by Marteq
Scoop.it!

Using Dashboards to Drive What Matters

Using Dashboards to Drive What Matters | The MarTech Digest | Scoop.it

A dashboard is such an important concept when it comes to easily accessing the health of a business.


There are many tools available to create dashboards, including Gecko Board (http://www.geckoboard.com/) and Cyfe (http://www.cyfe.com/) . Many spreadsheet experts and template creators are also able to bend and display data as a dashboard.


One of my favorite tools is Google Analytics Dashboards (http://www.seomoz.org/ugc/5-insightful-google-analytics-dashboards). You can create any custom layout, filter and goal and display it as your home dashboard. You can create specific dashboard for tracking things such as SEO or social media.


No scoop for you?  Not true!  You like?  Please RT, Like, Post and Share!

No comment yet.
Scooped by Marteq
Scoop.it!

Whitepaper: How to Create an Effective Marketing Dashboard

New information is cascading onto marketers’ computers at record pace. The biggest challenge is figuring out how to consume the data and translate it into better decision-making. How is this accomplished? The answer for an ever-increasing number of successful professionals is an effective marketing dashboard. Here are four steps you should follow.

No comment yet.