:: The 4th Era ::
139.8K views | +0 today
:: The 4th Era ::
Impact of the internet age on human culture and K-20 education policy/administration
Curated by Jim Lerman
Your new post is loading...
Rescooped by Jim Lerman from Into the Driver's Seat
Scoop.it!

The Effect of Social Media ( Infographic )

The Effect of Social Media ( Infographic ) | :: The 4th Era :: | Scoop.it

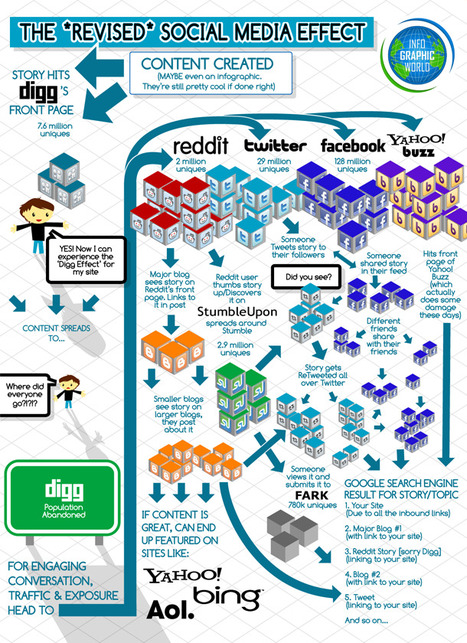
The following ===> infographic <=== covers the topic of social media and how it affects our content.


Would you imagine how social networking would be if there were no websites in the calibre of Stumble Upon, Twitter, Reddit, Digg, and Facebook ? I don't think we will have the same easy and instant access to the information as we do now.


We should be so thankful to those people behind the creation of such tools especially when we measure their importance and benefit in education.


Via Gust MEES, Jim Lerman
No comment yet.
Rescooped by Jim Lerman from Eclectic Technology
Scoop.it!

Designing Media-Based Assignments

Designing Media-Based Assignments | :: The 4th Era :: | Scoop.it
This website helps college teachers develop, deliver, and assess assignments incorporating images, video, and sound.


Beth Dichter's insight:

This website from the University Notre Dame provides great resources to help you embrace media-rich experiences for your students. The site currently has 24 projects which you may explore. Each project includes:

* A brief explanation

* Samples of projects

* Resources to help you learn how to make the projects

* Rubrics

The projects listed include: video story project, infographics, academic poster, book trailer, geographic map and many more.

Although this website was designed for college teachers the resources and ideas are useful for any teacher whom would to incorporate more media-based assignment in their classroom.


Via Beth Dichter
ech08ravo's curator insight, December 1, 2013 10:50 PM

Fantastic website from Notre Dame helps instructors (and students) design effective media-based assignments. Great examples and how-tos for inspiration.

Malin Fölster's curator insight, December 7, 2013 8:37 AM

Wow denna sida var sååå bra. Jag förlorade mig själv på denna sidan idag! :))) 

brendasherry's curator insight, April 21, 2014 9:58 AM

Awesome collection of ideas and exemplars...

Scooped by Jim Lerman
Scoop.it!

Infographics | Pew Research Center's Internet & American Life Project

Infographics | Pew Research Center's Internet & American Life Project | :: The 4th Era :: | Scoop.it

Description by Internet Scout Project


"The Pew Internet & American Life Project has compiled these infographics for use by journalists, scholars, and members of the general public. These visualizations represent the fruits of their substantial research into topics such as Internet usage, cell phone ownership, and social media. The site contains over 60 infographics and the materials here are culled from the Project's past reports, presentations, and commentaries. Arranged in chronological order, visitors can search all of the documents and will also find links to the Research Toolkit area. Visitors can also use the iPoll feature to search the Pew Internet database of questions."

No comment yet.
Rescooped by Jim Lerman from visual data
Scoop.it!

An Infographic About Infographics

An Infographic About Infographics | :: The 4th Era :: | Scoop.it

A picture is worth a thousand words, and Californian digital marketing agency, Bixa Media, have illustrated (pun intended) by creating an infographic about the importance of… well, infographics.


Based on the company’s research and insights, they found that visual data is absorbed 60,000x faster than text and people will only read about 20% of the text on a page.


Via Lauren Moss
No comment yet.
Rescooped by Jim Lerman from Wepyirang
Scoop.it!

How Do We Measure a Competency?

How Do We Measure a Competency? | :: The 4th Era :: | Scoop.it

Recently, I participated in two excellent Twitter chats on the #21stedchat hashtag. The first was about Assessing 21st Century Competencies and the second explored Marks and Grades in the 21st Cent...


Via Gust MEES, Jimun Gimm
Gust MEES's curator insight, January 23, 2013 10:26 AM

A MUST read!


Louise Robinson-Lay's curator insight, January 25, 2013 5:27 PM

21 st century learning skills.

Rescooped by Jim Lerman from 21st Century Learning and Teaching
Scoop.it!

6 Hot Trends in Educational Technology [#Infographic]

6 Hot Trends in Educational Technology [#Infographic] | :: The 4th Era :: | Scoop.it
Where does your school stand when it comes to adopting the latest classroom innovations?


Read more, a MUST:

http://www.edtechmagazine.com/k12/article/2012/11/6-hot-trends-educational-technology-infographic


Via Gust MEES
No comment yet.
Scooped by Jim Lerman
Scoop.it!

How the Internet is Revolutionizing Education

How the Internet is Revolutionizing Education | :: The 4th Era :: | Scoop.it
The Internet has transformed education dramatically, and in a very fundamental way: the grasp of power has shifted from the hands of the institution to those of the student.
No comment yet.
Rescooped by Jim Lerman from Scriveners' Trappings
Scoop.it!

Best Education Infographics - 2013

Best Education Infographics - 2013 | :: The 4th Era :: | Scoop.it
Infographics, when used correctly, appropriately, are powerful tools for conveying a lot of pertinent information plus they support visual learning and thinking.  I curate a Scoopit on Infographics...


Beth Dichter's insight:

Jackie Gerstein shares her top picks for education infographics this year. Some of these have been shared in this Scoop.it but many are new. The list of infographics includes:

* The Internet Access Gap in Education

* The Past, Present and Future of Education

* State of Creativity in Education: An Adobe Survey

* The Gamification of Education

* Tapping into Mobile Learning

* Investing in Girls' Education Pays Off

Many of these would be useful as topics for discussion or to use to teach students why infographics are useful in displaying data.


Via Beth Dichter, Jim Lerman
Beth Dichter's curator insight, December 29, 2013 9:33 PM

Jackie Gerstein shares her top picks for education infographics this year. Some of these have been shared in this Scoop.it but many are new. The list of infographics includes:

* The Internet Access Gap in Education

* The Past, Present and Future of Education

* State of Creativity in Education: An Adobe Survey

* The Gamification of Education

* Tapping into Mobile Learning

* Investing in Girls' Education Pays Off

Many of these would be useful as topics for discussion or to use to teach students why infographics are useful in displaying data.

eclat's curator insight, December 30, 2013 11:15 AM

Подтверждение того, что инфографика - должна быть важной составной частью обучения, в том числе в системе последипломного образования

Rescooped by Jim Lerman from 21st Century skills of critical and creative thinking
Scoop.it!

46 Tools To Make Infographics In The Classroom

46 Tools To Make Infographics In The Classroom | :: The 4th Era :: | Scoop.it
46 Tools To Make Infographics In The Classroom


Infographics are interesting–a mash of (hopefully) easily-consumed visuals (so, symbols, shapes, and images) and added relevant character-based data (so, numbers, words, and brief sentences).

The learning application for them is clear, with many academic standards–including the Common Core standards–requiring teachers to use a variety of media forms, charts, and other data for both information reading as well as general fluency. It’s curious they haven’t really “caught on” in schools considering how well they bridge both the old-form textbook habit of cramming tons of information into a small space, while also neatly overlapping with the dynamic and digital world.


Via Lynnette Van Dyke
Louise Robinson-Lay's curator insight, November 9, 2013 3:35 PM

creating infographics is easy using these sites. The most important thing is to do quality research first.

Raquel Oliveira's curator insight, November 10, 2013 9:26 AM

gosto de ferramentas que facilitem o aprndizado visualmente. Para quem compartilha da ideia, mas nao tem o dom grafico como eu...pode recorrer a algumas estrategias prontas...

Luís Cálix's curator insight, November 22, 2013 6:54 PM

Sempre apelativos os infográficos são uma boa ferramenta para trabalho na sala de aula. Esta lista é extensa e apresenta muito boas sugestões. A explorar.

Rescooped by Jim Lerman from Into the Driver's Seat
Scoop.it!

Need To Explain To Others What Content Curation Is? Use This Visual Collection

Need To Explain To Others What Content Curation Is? Use This Visual Collection | :: The 4th Era :: | Scoop.it
What is content curation about? Diagram, charts and infographics to make sense of the curation conundrum

Via Robin Good, Fab GOUX-BAUDIMENT, Jim Lerman
Ali Anani's curator insight, March 4, 2014 12:39 AM

Curate using this visual map

Monica S Mcfeeters's curator insight, March 30, 2014 9:18 AM

This will be helpful to share to those wondering about content curation.

Jeff Domansky's curator insight, September 1, 2014 11:53 PM

Valuable collection of the art of curation from Robin Good.

Rescooped by Jim Lerman from visual data
Scoop.it!

The Future of Data Visualization Tools

The Future of Data Visualization Tools | :: The 4th Era :: | Scoop.it

Data is everywhere and well-designed data graphics can be both beautiful and meaningful. As visualizations take center stage in a data-centric world, researchers and developers spend much time understanding and creating better visualizations. But they spend just as much time understanding how tools can help programmers and designers create visualizations faster, more effectively, and more enjoyably.


As any visualization practitioner will tell you, turning a dataset from raw stuff in a file to a final result in a picture is far from a single-track, linear path. Rather, there is a constant iteration of competing designs, tweaking and evaluating at once their pros and cons. The visualization research community has recognized the importance of keeping track of this process.


Read the complete article to learn more about the future of the practice and the tools that enable designers to create thoughtful infographics and visualizations...


Via Lauren Moss
No comment yet.
Rescooped by Jim Lerman from Resources and trend analysis for authors, webcopy writers and web developers
Scoop.it!

20+ Tools to Create Your Own Infographics

20+ Tools to Create Your Own Infographics | :: The 4th Era :: | Scoop.it


Via 173 Sud, Chrisange , Rose Marie DeSousa, massimo facchinetti, Becky Gaylord, John van den Brink, juandoming, olsen jay nelson
Alessio Manca's comment December 31, 2012 4:00 AM
GR8 Collection! TYVM John!
Alfredo Corell's curator insight, January 8, 2013 6:47 PM

While not everyone can make infographics from scratch, there are tools available on the Web that will help you create your very own infographics. In this article, they-re listing more than 20 such options to help you get your messages across to your readers, visually.


Some of them really simple. Most of them... visual. Try, gooo

Devrim Ozdemir, Ph. D.'s curator insight, January 9, 2013 8:39 AM

While not everyone can make infographics from scratch, there are tools available on the Web that will help you create your very own infographics. In this article, they-re listing more than 20 such options to help you get your messages across to your readers, visually.


Some of them really simple. Most of them... visual. Try, gooo

Rescooped by Jim Lerman from 21st Century skills of critical and creative thinking
Scoop.it!

10 Amazing #SocialMedia Statistics [INFOGRAPHIC]

10 Amazing #SocialMedia Statistics [INFOGRAPHIC] | :: The 4th Era :: | Scoop.it

Did you know that Twitter is grabbing more new registrations than Facebook, with more than half of its entire userbase compromised of people who have signed up in the last year, compared to just 19 percent for Mark Zuckerberg’s baby?

What if I said that almost a quarter (23 percent) of Facebook users check their account five or more times each day, Twitter users are 33 percent more likely to be Democrats or – sorry Foursquare – that 74 percent of Americans are unfamiliar with the concept of ‘checking in’.


These, and several other amazing social media statistics, can be found in the infographic on social media statistics...


Via Lauren Moss, John van den Brink, Gladys Pintado, Khaled El Ahmad, David Hain, Lynnette Van Dyke
LuciaSilva's comment, October 7, 2012 4:35 PM
Great post!
iPhone Developer's comment, October 12, 2012 7:51 AM
That's ow some good job
Ciberbebe.com's curator insight, July 23, 2013 4:56 AM

#socialmedia statistics