:: The 4th Era ::
139.8K views | +0 today
Follow
:: The 4th Era ::
Impact of the internet age on human culture and K-20 education policy/administration
Curated by Jim Lerman
Your new post is loading...
Rescooped by Jim Lerman from visual data
Scoop.it!

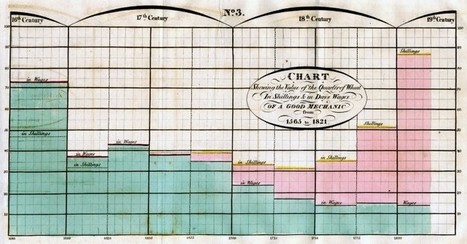
Data Visualization 101: Bar Charts

Data Visualization 101: Bar Charts | :: The 4th Era :: | Scoop.it

'In our Data Visualization 101 series, we cover each chart type to help you sharpen your data visualization skills.

Bar charts are a highly versatile way to visually communicate data. Decidedly straightforward, they can convey the message behind the numbers with impact and meaningful clarity, making complex data easy to understand at a glance.'


Via Lauren Moss
No comment yet.
Rescooped by Jim Lerman from visual data
Scoop.it!

The 11 Most Fascinating Charts From Mary Meeker's Epic Slideshow of Internet Trends

The 11 Most Fascinating Charts From Mary Meeker's Epic Slideshow of Internet Trends | :: The 4th Era :: | Scoop.it
Facebook is the only major social network in decline. Saudis share more online than anyone. You check your phone 150 times a day. And more.


Every year, Mary Meeker and the team from KPCB unleash upon the world the mother of all slideshows, which aims to sum up The State of the Internet. This year's behemoth was born this morning, weighing in at 117 pages. Here are the 12 most interesting pages.

Check out the full report here.


Via Lauren Moss
No comment yet.
Scooped by Jim Lerman
Scoop.it!

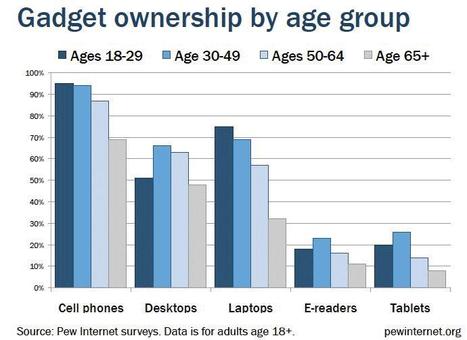
Infographics | Pew Research Center's Internet & American Life Project

Infographics | Pew Research Center's Internet & American Life Project | :: The 4th Era :: | Scoop.it

Description by Internet Scout Project


"The Pew Internet & American Life Project has compiled these infographics for use by journalists, scholars, and members of the general public. These visualizations represent the fruits of their substantial research into topics such as Internet usage, cell phone ownership, and social media. The site contains over 60 infographics and the materials here are culled from the Project's past reports, presentations, and commentaries. Arranged in chronological order, visitors can search all of the documents and will also find links to the Research Toolkit area. Visitors can also use the iPoll feature to search the Pew Internet database of questions."

No comment yet.