


 Your new post is loading...

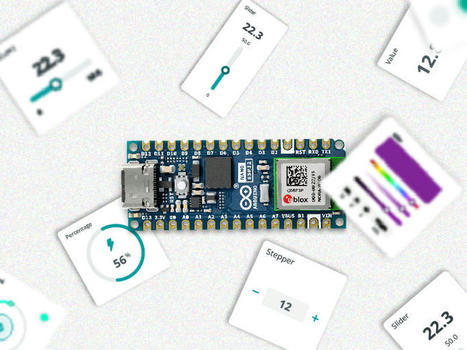

For users delving into the exciting world of DIY IoT, one common challenge that they frequently find is how to effectively visualize the data generated by their custom-made devices using mobile apps or web browsers. These devices, often built around Arduino or ESP boards, empower makers to craft innovative solutions for a wide range of applications. However, the missing piece of the puzzle is to find a simple, straightforward and reliable way to visualize and interact with the sensor data.


