Teaching and Learning in HE
1.1K views | +0 today
Follow
Teaching and Learning in HE
Your new post is loading...
Rescooped by Scott Turner from visual data
Scoop.it!

Infographic: 29 Ways To Be Creative

Infographic: 29 Ways To Be Creative | Teaching and Learning in HE | Scoop.it

Creativity is defined as the ability to create, but sometimes, we seem to lose that ability all of a sudden. 

Luckily, Jordan-based art director Islam Abudaoud has created a useful infographic that teaches us ways to stay creative. 

Titled ‘29 Ways To Stay Creative’, the infographic illustrates the “creative process and methods to keep a person moving forward and motivated to keep doing more”. 

For more information, check out the infographic at designtaxi.com...


Via Lauren Moss
bancoideas's curator insight, March 4, 2013 9:36 AM

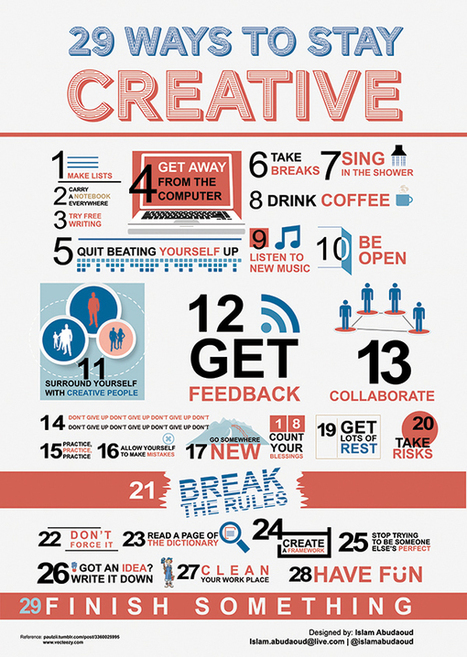
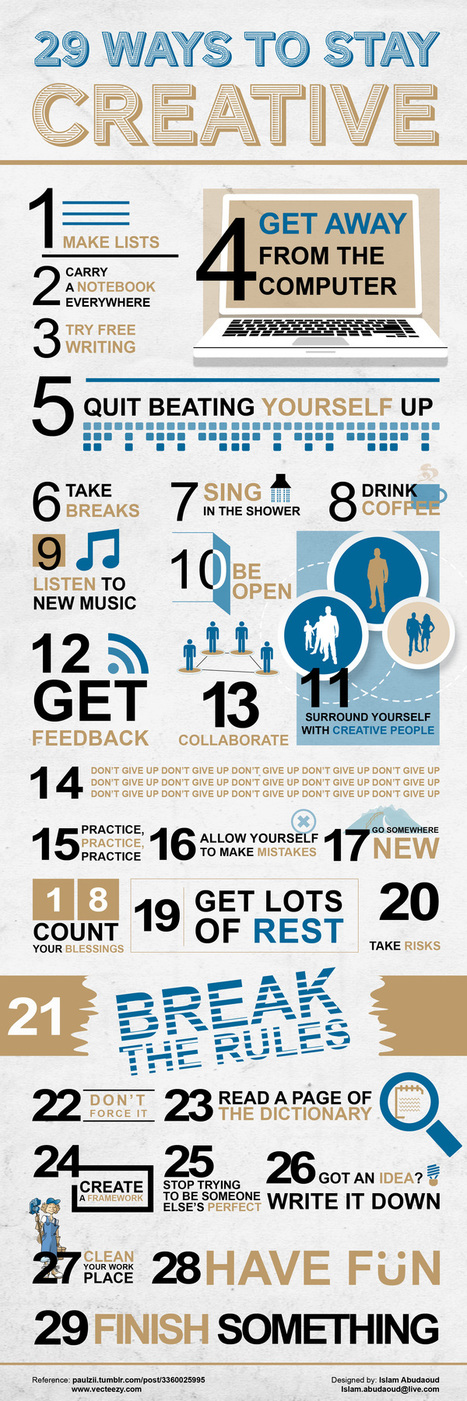
Existen muchas de estas infografías con tips para ser, volverse, o mantenerse creativo, y para serte francos, nos gustan todas! =)

Jacqui Hogan's curator insight, March 14, 2013 10:26 AM

EVERYone can be creative. 

Julien CHARLES's comment, May 16, 2013 7:40 AM
Really interesting and inspiring - Thx a lot.
Rescooped by Scott Turner from The 21st Century
Scoop.it!

Top 29 Best Ways to Stay Creative in Life Inspirational | All Infographics

Top 29 Best Ways to Stay Creative in Life Inspirational | All Infographics | Teaching and Learning in HE | Scoop.it
Infographics on being creative in life and inspiration with top 29 ways to be creative on success and startup exploring and researching ideas and concept...
Via Dr. Susan Bainbridge
EV's comment December 22, 2012 3:46 AM
http://allinfographics.org/top-29-best-ways-to-stay-creative-in-life-inspirational
Kathy Jordan's curator insight, February 10, 2013 11:27 AM

I need motivation to stay creative and this infographic by @all_infographic is a winner.

Ana Gea's curator insight, March 19, 2013 9:03 PM

Most importantly- Have fun & Finish something. 

Rescooped by Scott Turner from visual data
Scoop.it!

Data Visualization: Communication & Creativity

Data Visualization: Communication & Creativity | Teaching and Learning in HE | Scoop.it

Visual communication skills are alien to some in the research industry, but they needn’t be. Data visualisation can become part of the research process through smart hiring, skills training and expert partnerships.


Data visualisation should not be regarded as an end in itself; the real point to data visualisation - the value that it brings to research buyers and suppliers - is as an aid to storytelling. It’s about seeing the patterns in the data that flush out a story and then help you to start telling that story. Only by doing that can you move data off the spreadsheet and out into the real world of consumer behaviour and preferences.

The best analogy and the one used frequently, is with journalism. It’s no surprise either that many great examples of data visualisation come from the publishing and media sectors. Journalists face the same challenge that we do of sifting large amounts of often conflicting data to arrive at a truth or an insight...


Via Lauren Moss
Scott Turner's insight:

An interesting look at the current role of data visualization and data journalism in the advancement of research, communication, and brand development.

Lauren Moss's curator insight, January 8, 2013 4:23 PM

An interesting look at the current role of data visualization and data journalism in the advancement of research, communication, and brand development.