

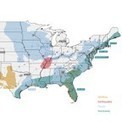

With “The 2100 Project: An Atlas for A Green New Deal,” the McHarg Center tries to visualize how the warming world will reshape the United States.
Get Started for FREE
Sign up with Facebook Sign up with X
I don't have a Facebook or a X account


 Your new post is loading...
 Your new post is loading...
Your new post is loading...
With “The 2100 Project: An Atlas for A Green New Deal,” the McHarg Center tries to visualize how the warming world will reshape the United States. 
No comment yet.
Sign up to comment
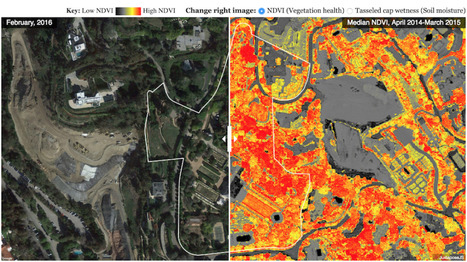
Reveal’s analysis found seven possible candidates for California’s biggest water user. Here’s how we did it.
PIRatE Lab's insight:
A great piece of "data journalism."
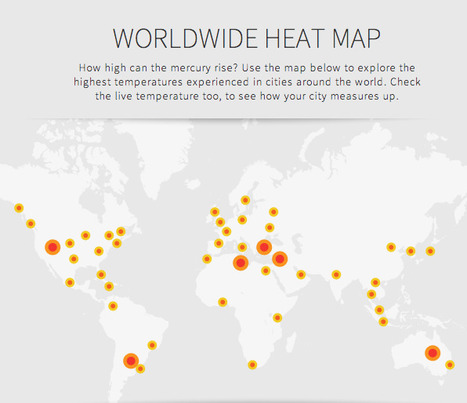
The Andrew Sykes Group, a large air conditioning firm based in the UK, has developed this interactive displaying record highs, and current temperatures from select cities across the globe. While Climate Central's interactive tool (displaying the average temperature cities across the U.S. are expected to reach by 2100) did little to make those of us suffering a sweltering summer feel optimistic about the future, the interactive graphic at the link provides some perspective that current temperatures could be worse. The Andrew Sykes Group has developed this interactive displaying record highs, and current temperatures from select cities across the globe. Smaller nodes represent cities, while larger nodes stand for the hottest temperatures ever seen on each continent. Via Lauren Moss

Stephane Bilodeau's curator insight,
August 9, 2014 8:08 PM
The Andrew Sykes Group has developed this interactive displaying record highs, and current temperatures from select cities across the globe. Smaller nodes represent cities, while larger nodes stand for the hottest temperatures ever seen on each continent.
Rio de Janeiro, Feb 22 (EFE).- Brazil's portion of the Amazon rainforest lost between August 2013 and January this year some 1,162.5 sq. kilometers (448.8 sq. miles) of woodland, an area 19 percent less than the amount deforested between August 2012 and January 2013, which was 1,427 sq. kilometers (551 sq. miles), the government said.
Did you know that almost 90% of the world’s population lives in the northern hemisphere? And that half of all Earthlings [1] reside north of 27°N? Or that the average human lives at 24 degrees from the equator - either to its north or south?
PIRatE Lab's insight:
An interesting take on where people live. While there are many caveats (about density, habitable area, etc.) which covary, the original map is still interesting to look at.
Thanks to Seth for re-posting this!
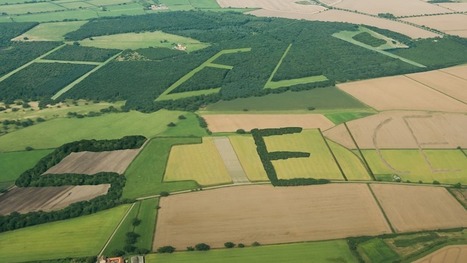
A computer game wants you to map the world's cropland so farmers can get more out of each harvest.
PIRatE Lab's insight:
These types of approaches to crowd sourcing are becoming bigger and bigger by the day it seems.

Jacqueline Landry's curator insight,
December 17, 2013 7:34 PM
This is cool, there are many agricultural types and you can see It here. different land areas have different soil and chemicals in it which certain types of crops can benefit from. It is important to know these things. |
NASA scientists have just released the first new global map of Earth at night since 2012. This nighttime look at our home planet, dubbed the Black Marble, provides researchers with a unique perspective of human activities around the globe. By studying Earth at night, researchers can investigate how cities expand, monitor light intensity to estimate energy use and economic activity, and aid in disaster response.
PIRatE Lab's insight:
A perenial favorite in the "human footprint" slideshows of a generation of environmental scientists.

Ivan Ius's curator insight,
April 20, 2017 12:19 PM
Geographic Thinking Concepts: Patterns and Trends, Geographic Perspective, Spatial Significance

Colleen Blankenship's curator insight,
August 13, 2018 11:50 AM
This kind of data also correlated with population density and location.
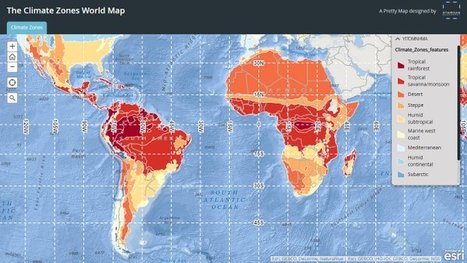
"Obsessed as we are with cartography we in Staridas Geography perceive any aspect of the actual 3D World as a constant opportunity for another pretty map creation!"

GTANSW & ACT's curator insight,
August 19, 2016 7:47 PM
Great map to discuss global distribution of biomes and links to climate 
Sally Egan's curator insight,
August 21, 2016 6:24 PM
Fun way for students to learn about the diverse climates around the world, by selecting a location on the map students are shown the climatic data of the selected place.
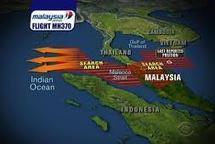
Crowdsourcing website, Tomnod.com, being used to enable public to join in the hunt for the missing aircraft.
PIRatE Lab's insight:
Leveraging crowdsourcing and citizen science to find the missing plane. We can also harness these same forces for conservation/disaster management.
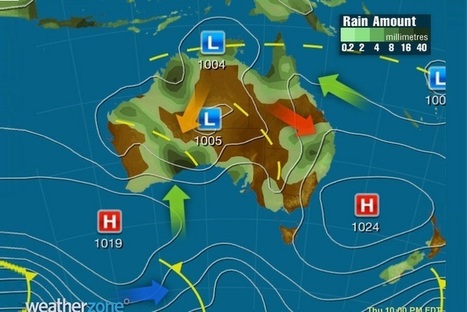
Researchers at the University of Adelaide have been exploring how using public weather forecast information can help deliver significant reductions in energy consumption.
Combining information from the Bureau of Meteorology with data from existing building management systems, the researchers have developed an intelligent model that remains one step ahead of the building’s temperature changes, automatically adjusting the heating and cooling supply accordingly. Early experimental results have provided encouraging results, with at least 10 per cent energy savings shown to be possible. Via Lauren Moss

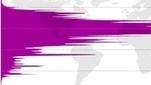
The million-plus amateur cartographers who volunteer their time to plot roads, streets, and even shrubbery for Open Street Map were busier than ever this year. The beautiful map above, created by MapBox, shows how the database has grown since its inception in 2004. Hot pink areas are newly mapped, blue and green areas are older. (scroll down a screen length or two for the zoomable version within Mapbox's annual report). OSM's database of more than 21 million miles of roads and 78 million buildings, keeps finding new uses, such as helping first responders to disasters like this year's typhoon Haiyan in the Philippines.
PIRatE Lab's insight:
This open map project has finally gotten to the point where it seems generally useful for larger regional studies of coastal zones/road infrastructure.
It is great having both the formal google earth/apple maps datasets AND these more open-source datasets.

PIRatE Lab's curator insight,
December 28, 2013 11:57 PM
This open map project has finally gotten to the point where it seems generally useful for larger regional studies of coastal zones/road infrastructure.
It is great having both the formal google earth/apple maps datasets AND these more open-source datasets. |


