Your new post is loading...


Educators know we encounter many different types of learners in our classroom. Science class affords us the opportunity to meet the needs of hands-on, auditory, and visual learners. As we are faced with the task of teaching remotely, connecting with these types of learners is vital to our success.
One significant challenge familiar to all science teachers is getting students to understand data that is placed in front of them. Students often struggle with looking at different data sets and trying to make comparisons and interpretations.
My solution? Infographics. Infographics has been a great way for me to engage my students with data and encourage them to apply creative as well as critical thinking. And with the shift to online learning, I’m finding infographics more useful than ever.
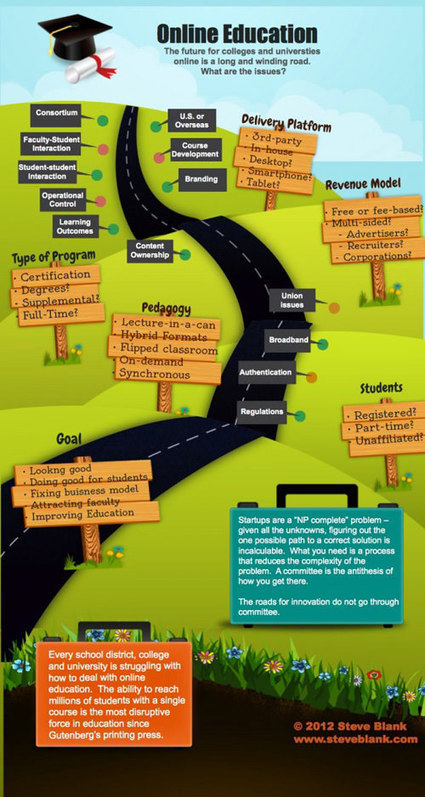
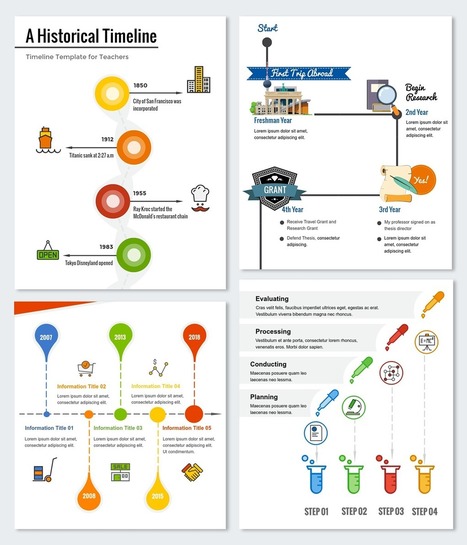
What Are Infographics?
Via John Evans, massimo facchinetti


![Six Steps to Creating a Successful Infographic for Your Business [Infographic] | Soup for thought | Scoop.it](https://img.scoop.it/j-i36KCaWUQfk24Gxcs93zl72eJkfbmt4t8yenImKBVvK0kTmF0xjctABnaLJIm9)