 Your new post is loading...
It's been a white-hot week so far for digital marketing statistics. We've seen numbers roll in about Reddit viewers, digital-media growth, bad ads, web bots, Amazon Echo, ecommerce and the hit film La La Land.
Check out these dozen data points that grabbed our attention:
1. Big Game versus going big on Snapchat
On Thursday, we looked at how many types of digital ads equaled the cost of a 30-second Super Bowl TV spot, which comes in at $5.6 million this year. For Snapchat sponsored lenses, 17 of them add up to one Big Game commercial. A branded lens on the mobile app, according to digital agency Essence, costs roughly $329,400.
2. Redditors love mobile reading
Reddit didn't have a mobile app one year ago today, but on Wednesday it revealed that more than 40 percent of its content views occur via its app....
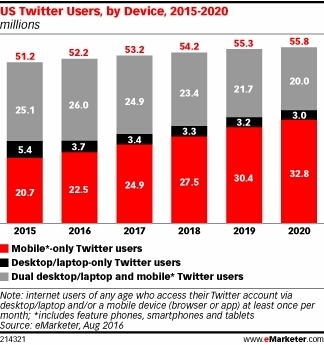
Twitter, which has struggled to grow its user base to the size of some of its social networking rivals, is reporting earnings this week not long after news that companies including Disney would not be moving to acquire the service. This year, eMarketer estimates, more than 52 million people in the US will use Twitter on a monthly basis, and just shy of half will use the service on both PCs and mobile devices. Mobile-only Twitter use is becoming more common in the US as desktop- based usage shrinks, and will account for a majority of US users in 2018 for the first time. Currently, just 19.5% of internet users and 16.1% of the population of the US uses Twitter, compared with 51.5% of the population using Facebook. On a worldwide basis, Twitter penetration is even lower: Only 3.9% of people around the world use Twitter this year, and by 2020 the figure is only expected to rise to 4.8%....
Here’s an interesting stat – according to a Pinterest survey of 2,500 Pinners (conducted in May this year), 45% of users are active on the app while watching TV.
That’s surprising – normally it’s Twitter that’s identified as the ultimate TV viewing companion in social, given its position as the home of real-time conversation, particularly around live events.
As it turns out, Pinnners, too, love to multi-screen:
“64% of our users tell us they pay more attention to what they’re doing on Pinterest than what they’re watching on TV—and 44% of them will engage with Pinterest for the show’s entirety, regardless of whether it’s on a commercial break or not.”...
Social networks occupy more of the digital space than ever before. We decided to conduct a research to shed light on some of the interesting points of social media usage. You can download the high resolution infographic at the end of this article.
As always, at ResearcEgg facts come first. We asked 1,000 social media users in the US and we ended up with a rather interesting data set. We have put together an infographic to visualize the key finds. Now, let’s get into the data!...
Are you wondering how your competitors are using social media?
Have you explored what works for other businesses?
If you analyze the social media efforts of other businesses you’ll find insights to improve your own social media marketing.In this article you’ll discover four ways to research what your competitors are doing on Facebook, Twitter and Google+....
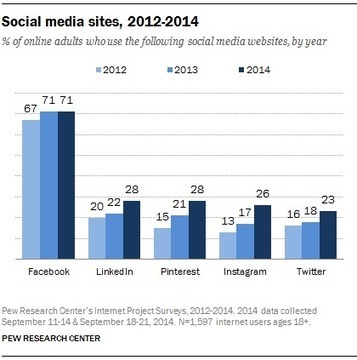
In a new survey conducted in September 2014, the Pew Research Center finds that Facebook remains by far the most popular social media site. While its growth has slowed, the level of user engagement with the platform has increased.
Other platforms like Twitter, Instagram, Pinterest and LinkedIn saw significant increases over the past year in the proportion of online adults who now use their sites....
We all know a picture speaks thousand words and for that reason infographics are being more popular due to its amazing information displayed in the form of images. It has the capability to capture everyone’s eye and tell them a story with engaging content and images. It’s an all in one package with text, images and creative design that come all along. It holds a great marketing potential that has the ability to attract customers. Many people click on infographics as it is more appealing and hence your web traffic is increased which is beneficial aspect for SEO.
Here we have the collection of 10 interesting infographics about social media. Let’s have a look at them below.
Social media like Facebook and Twitter are far too biased to be used blindly by social science researchers, two computer scientists have warned.
Writing in today’s issue of Science, Carnegie Mellon’s Juergen Pfeffer and McGill’s Derek Ruths have warned that scientists are treating the wealth of data gathered by social networks as a goldmine of what people are thinking – but frequently they aren’t correcting for inherent biases in the dataset.
If folks didn’t already know that scientists were turning to social media for easy access to the pat statistics on thousands of people, they found out about it when Facebook allowed researchers to adjust users’ news feeds to manipulate their emotions....
What’s the number one social network around the world?
Facebook, right? With more than 1.3 billion active users, Mark Zuckerberg’s platform dwarfs Twitter, Pinterest, Instagram and Google+ combined. But throw YouTube into the mix, and things start to get a little weird.
GlobalWebIndex surveyed internet users aged 16-64 about their social media habits and found that while Facebook easily beat YouTube and Twitter for overall membership and active usage numbers amongst respondents, more people said that they had visited YouTube in the past month than any other channel in the survey....
Facebook is for ice bucket challenges. Twitter is for Ferguson, Mo. That’s been the conventional wisdom in the past few months; that conversation about breaking news is happening mostly on Twitter, while people are using Facebook to share less timely — some would say less newsworthy — topics. The evidence for this conclusion has been anecdotal, which is almost always the case when you are comparing results produced by Facebook’s opaque News Feed algorithm to anything. So any time there’s a chance to dig into data that sheds light on public social sharing activity, it’s wise to seize it.
The quarterly report of consumer sharing behavior published this week by social data and sharing tool provider ShareThis offers such an opportunity. And while the data, drawn from the 450 million unique users and 2.5 million sites and apps in the ShareThis network, doesn’t directly address the ice-bucket-vs.-Ferguson question, it does provide some interesting marketing takeaways....
A study released by the Acquity Group, part of Accenture Interactive, has found that 94 percent of B2B buyers conduct some research before making a purchase, with 55 percent of them doing so for at least half of their purchases.
XThe “State of B2B Procurement” report looked at 500 B2B procurement officers with annual purchasing budgets of approximately $100,000. The goal was to determine how B2B companies adapt and stay competitive through their purchasing decisions.
About 68 percent of B2B buyers purchase goods online, compared to 57 percent cited in the 2013 version of the study. Nearly 44 percent of respondents said that they researched goods and services on a smartphone or tablet over the past 12 months....
How much of our social media behavior is founded upon fact? I decided to dig into the data and do some research.
_...Since most of us use Facebook, we think we know how effective it will be, or what kind of posts garner the most attention and interaction. Since we have a Twitter account, we have a sense of knowledge about how it works, and what a business should do (or not do) on Twitter.All that is great, but how much of our social media behavior is founded upon fact?
I decided to dig into the data and do some research. What I’ve extracted below are five surprising data points that will have a profound effect on how you approach social media....
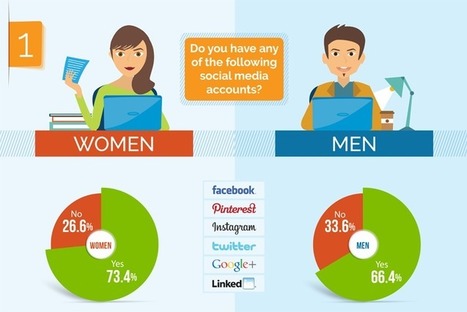
We had fun checking social media demographics surveys from different credible sources like Pew Research Center and Burst Media and we were able to pluck out some distinct patterns that suggest women are taking over social media and we’ve turned the data into a nice infographic.
The infographic shows that women not only use social media more often than men, but they use these sites in more ways. More women also use the top social media sites and they dominate the visual-type social websites, which are the fastest growing social networks today. No site establishes women’s dominance in social media more than Pinterest, where 33% of U.S. women online access Pinterest (for men it’s only 8%).
But more tellingly is how women lead the trend of accessing social media via mobile. Forty-six percent of women use their smartphones to check their social account versus 43% for men. Likewise, 32% of women use a tablet versus 20% of men for the same reason. Now juxtapose that to the Business Insider report saying 60% of social media time is spent on smartphones and tablets, and you’ll realize women will be setting the pace towards social mobiles....
|
Each year brings huge changes in social media, and 2016 was no exception. Here are five social stats from 2016 that will take you by surprise.
The current state of the media universe presents a bounty of boundless choice to today’s consumer. Like the cosmos, which is contemplated much in current times, the proliferation of devices and the abundance of media choices is presenting endless options for the consumer and endless challenges and opportunities for the marketer. Nielsen is reaching new frontiers by totaling up audiences across devices and burgeoning viewing platforms. Consumer engagement is reaching new heights.
The data used in this graphic is inclusive of multicultural audiences. Hispanic consumer audiences are composed of both English and Spanish speaking representative populations....
Stop. Wait a minute. Put down whatever you’re doing and pay attention. We spend a lot of time reading about the trends sweeping the marketing world, and the growing influence of social media on customers purchase decisions....
Automation anxiety reached new heights in 2013, when Carl Benedikt Frey and Michael A. Osborne, researchers at the Oxford Martin School, published a paper estimating that 47% of all U.S. jobs were “at risk” of being computerized over the next two decades. Although the jury is still out about robots stealing jobs, the pace at which AI and deep learning technologies have been advancing isn’t ebbing concerns over a future of disappearing work. As machines increasingly perform complex tasks once thought to be safely reserved for humans, the question has become harder to shrug off: What jobs will be left for people?
A new NBER working paper suggests it’ll be those that require strong social skills — which it defines as the ability to work with others — something that has proven to be much more difficult to automate. “The Growing Importance of Social Skills in the Labor Market,” shows that nearly all job growth since 1980 has been in occupations that are relatively social skill-intensive — and it argues that high-skilled, hard-to-automate jobs will increasingly demand social adeptness....
One of the most viral and popular means of connecting with consumers in an interpersonal manner and encouraging a healthy conversion rate during the present day is via social media.
Shoppers these days are more technologically savvy than ever before, and most are using one or more social channels on a daily basis. The most current social shopping statistics shine a bright light on the real impact.
Social Referrals Generate Strong Sales
According to online think tank Statistica, in 2013 alone, there were over 157 million online shoppers that were referred by social media networks. Websites like Twitter actually boast a higher conversion rate than standard internet users, according to Media Bistro, with 75% of Twitter users making at least one or more purchases per month, as contrasted to just 67% of internet users overall.
Furthermore, a report by Sprout Social finds that about 74% of all consumers rely upon social networks to make a purchasing decision. This can range from reading a review or learning about a purchase that was made by friends; or from seeing a product favorite, liked, tweeted, pinned and shared....
Consumers prefer to receive marketing messages, special offers, and coupons from brands via email more than any other communication channel, according to a recent report from Message Systems.
The report was based on data from a survey conducted in September 2014 from 500 adult Internet users in the United States.
Half of respondents say they do not want to receive any marketing communications at all from brands.
A quarter say they prefer to be contacted by email, the most popular communication channel by far.
Some 9% like text messages and 7% are fans of snail mail. Just 5% of respondents say social media is their preferred way of being contacted with marketing messages and offers....
Sales leaders on Twitter most often talk about marketing, social selling, leadership, technology, and sports, according to a recent report from Leadtail and Hoovers.
The report was based on an analysis of the Twitter accounts of 580 North American sales leaders (identified by job titles, such as VP/SVP of Sales, Director of Sales, etc.). The data set included B2B and B2C salespeople from both inbound and outbound sales operations. A total of 68,310 tweets and 44,043 links shared between July and September 2014 were examined.
The analysis found the hashtags used most frequently by sales leaders included a mix of terms related to business (#sales, #BigData, #LinkedIn), topical issues (#alsicebucketchallenge, #ferguson), sports (#NFL, #SFGiants), and personal betterment (#fitness, #inspiration, #motivation)....
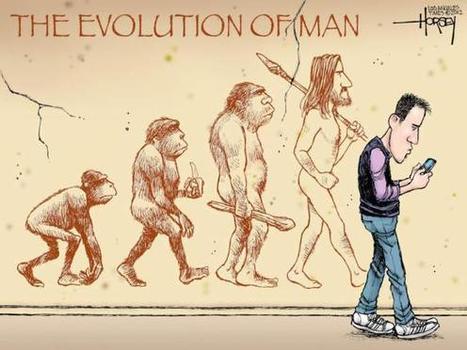
As described by Brian Solis “Digital Darwinism is the evolution of consumer behavior when society and technology evolve faster than some companies’ ability to adapt.
”The point of natural selection is that not every business will make it. As Edward Lawler and Christopher Worley note in their book Built to Change, “An analysis of Fortune 1000 corporations shows that between 1973 and 1983, 35% of companies in the top 20 were new.” Their work showed that the number of new companies rose to 45 percent between 1983 and 1993. That number increased to 60 percent between 1993 and 2003.
And, as they so appropriately asked, “Any bets [as] to where it will be between 2003 and 2013?”
To further their point, a recent ad produced by Babson College cited a rather humbling statistic; “Over 40% of the companies that were at the top of the Fortune 500 in 2000 were no longer there in 2010.
”What separates brands that falls to digital evolution from those that excel is the ability to recognize the need for change and the vision to blaze a path toward renewed relevance among a new generation of consumers....
The trend of assigning a single score to a digital marketing value continues.
Today, Chicago-based social engagement platform Earshot is joining the movement with its own social relevancy score.
Called the Decibel Level, it is a measurement of whether a person is a good prospect for a sale or other conversion in a given brand campaign....
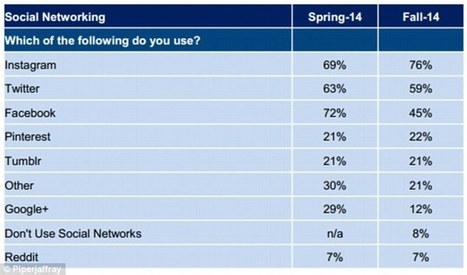
A new survey by investment bank Piper Jaffray found that more than 9 out of 10 American teenagers regularly use social media - and Facebook is not longer their preferred choice.
If you follow more than a handle of accounts, your Twitter stream can quickly become a firehose of irrelevant information. Because of this, many veteran users never visit their stream. Instead, they create lists or run saved searches.
Here are a few other options to help you filter your Twitter stream for more useful, relevant, information....
Did you know that more than 50 percent of internet users either don't use any social networking site or use only one. And that Facebook mobile ads on iPhones generate more than 1000 percent higher Return-on-Investment (ROI) than ads on Android devices.
A new infographic created by Imediaconnection reveals that, as of late 2013, 44 percent of companies still weren't measuring social value in their organizations, while nearly a fifth of companies that have measured social ROI found its value to be negative.
Moreover 21 percent of senior marketers label themselves as "dissatisfied" with social media marketing....
|


![Pinterest and TV Go Hand-in-Hand [Infographic] | Public Relations & Social Marketing Insight | Scoop.it](https://img.scoop.it/zVT15sOZItW9agst1e5yQzl72eJkfbmt4t8yenImKBVvK0kTmF0xjctABnaLJIm9)


Social marketing research you can use.