


 Your new post is loading...


A very long, very bold to-do list for the next 20 years.
The city of Toronto has already begun to sketch out policies that could reduce the area’s greenhouse gas emissions in the coming decades. Officials have proposed greening the electric grid, banning incandescent light bulbs, promoting green roofs on commercial buildings, retrofitting 1960s-era high-rises and implementing a stricter energy-efficient building code for new construction. With transportation, the city wants to expand bike lanes and transit infrastructure, all while it anticipates that electric vehicles will grow slowly more common.
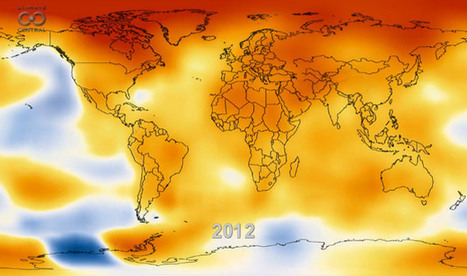
This is a pretty standard menu of ideas, and according to scientists it will get the city part of the way toward the kind of changes broadly needed to really keep global temperature rise below 2 degrees Celsius.
But to really alter the future prospects for climate change, much more will have to happen in Toronto, and every other city. Researchers used the city as a case study to model what a truly aggressive framework might look like. If Toronto wants to cut emissions by 70 percent by 2031, all of these actions (or others with a similar impact) might be required in tandem...
Via Lauren Moss


While the steps being proposed in Toronto may not be as aggressive as those recommending by researchers concerned with reversing the climate changes caused by humanity's activity, they are at least a step in the right direction and far more than what seems likely in most U.S. cities.