


 Your new post is loading...

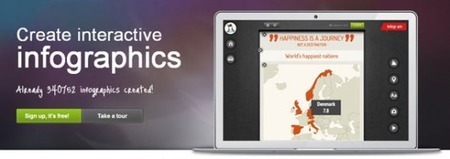

Inforgraphic is “graphical representation of information and data”. Infographics are often generally used to represent concisely data and statistics, or relationships or differences between two or more issues. When reading an article, it is always desirable to find the information visually since our brain is always going to digest and remembered it more easily. Moreover,(...)
Via Stefano Principato


Here are a number of freeware tools to create our own original infographics.
Depending on the needs us more fit either, and basically all are easy to use without requiring extensive technical knowledge.
Why Dipity:
visually engaging timelines that integrate video, audio, images, text, links, social media, location and timestamps.