


 Your new post is loading...

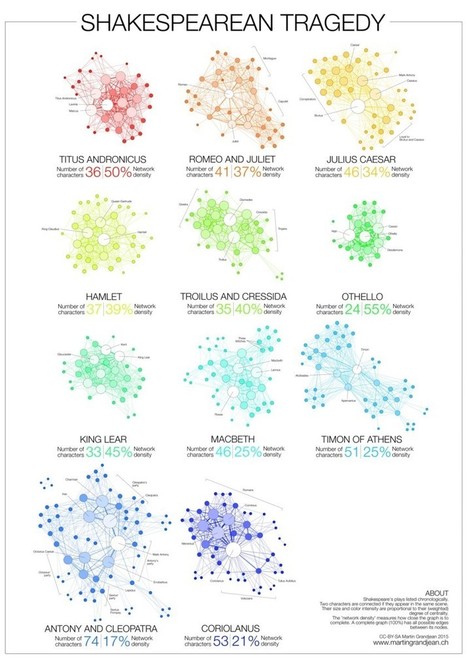

Eleven tragedies are analyzed, including Romeo and Juliet, Julius Caesar, Macbeth, and King Lear. Each chart presents all characters from a specific tragedy. Each character is represented as a circle. The more important the character the bigger the circle.
The lines connect characters to other characters with whom they interact in the same scene. Another dimension that Martin Grandjean is using is network density. It measures how close the graph is to complete.
Hamlet is the longest tragedy but its character map is much simpler and less dense than, for instance, Anthony and Cleopatra. But its network density is twice as big – 39% versus 17%.


