Machines Pensantes
48.2K views | +0 today
Follow
Machines Pensantes
La vie sous toutes ses formes
Your new post is loading...
Scooped by association concert urbain
Scoop.it!

Metrics, metrics everywhere: How do we measure the impact of JOURNALISM?

Metrics, metrics everywhere: How do we measure the impact of JOURNALISM? | Machines Pensantes | Scoop.it
We need to get beyond counting pageviews and ad impressions and build better ways of judging how our work changes the world around us.

[...] If democracy would be poorer without journalism, then journalism must have some effect. Can we measure those effects in some way? While most news organizations already watch the numbers that translate into money (such as audience size and pageviews), the profession is just beginning to consider metrics for the real value of its work.

[...] Evaluating the impact of journalism is a maddeningly difficult task. To begin with, there’s no single definition of what journalism is. It’s also very hard to track what happens to a story once it is released into the wild, and even harder to know for sure if any particular change was really caused by that story. It may not even be possible to find a quantifiable something to count, because each story might be its own special case. But it’s almost certainly possible to do better than nothing.

No comment yet.
Rescooped by association concert urbain from visual data
Scoop.it!

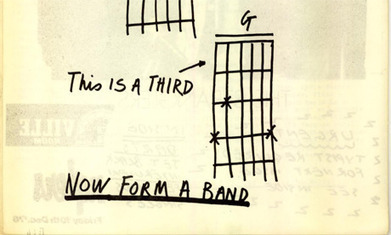
Can anyone be a data journalist? : Anyone can do it. Data journalism is the new punk

Can anyone be a data journalist? : Anyone can do it. Data journalism is the new punk | Machines Pensantes | Scoop.it

Can anyone be a data journalist?

Simon Rogers on what we can learn from a 1977 diagram...


Now is the time to examine this - in May 2010, we published this piece on how reporters would soon be flooded with a "tsunami of data". Two years on and data journalism is part of the fabric of what we, and many other news organisations do.


What is it? I would say data journalism is such a wide range now of styles - from visualisation to long form articles. The key thing they have in common is that they're based on numbers and statistics - and that they should aim to get a 'story' from that data. The ultimate display of that story, be it words or graphics, is irrelevant, I think - it's more about the process...


Via Lauren Moss
No comment yet.