Machines Pensantes
48.2K views | +0 today
Follow
Machines Pensantes
La vie sous toutes ses formes
Your new post is loading...
Rescooped by association concert urbain from Public Relations & Social Marketing Insight
Scoop.it!

The 37 BEST tools for data visualization

The 37 BEST tools for data visualization | Machines Pensantes | Scoop.it

Not a web designer or developer? You may prefer free tools for creating infographics.


As author, data journalist and information designer David McCandless said in his TED talk: “By visualizing information, we turn it into a landscape that you can explore with your eyes, a sort of information map. And when you’re lost in information, an information map is kind of useful.”


There are many different ways of telling a story, but everything starts with an idea. So to help you get started we’ve rounded up some of the most awesome data visualization tools available on the web....


Via Jeff Domansky
Winners Education's curator insight, March 26, 2015 12:24 PM

Adressing the visula part of the learning brain with easy-to-use, web-dased tools 

Vinicius Vinny Araujo's curator insight, April 17, 2015 12:55 AM

#data

Nora Morton's curator insight, April 22, 2015 6:23 PM

Colorful charts/graphs/maps are my type of eye candy!  This site illustrates the vast ways you can visually present data.  Among the many: iChart, Polymaps, Google Charts, Many Eyes, Leaflet, Exhibit, and Zing Chart. 

Rescooped by association concert urbain from visual data
Scoop.it!

Data Visualization: Communication & Creativity

Data Visualization: Communication & Creativity | Machines Pensantes | Scoop.it

Visual communication skills are alien to some in the research industry, but they needn’t be. Data visualisation can become part of the research process through smart hiring, skills training and expert partnerships.


Data visualisation should not be regarded as an end in itself; the real point to data visualisation - the value that it brings to research buyers and suppliers - is as an aid to storytelling. It’s about seeing the patterns in the data that flush out a story and then help you to start telling that story. Only by doing that can you move data off the spreadsheet and out into the real world of consumer behaviour and preferences.

The best analogy and the one used frequently, is with journalism. It’s no surprise either that many great examples of data visualisation come from the publishing and media sectors. Journalists face the same challenge that we do of sifting large amounts of often conflicting data to arrive at a truth or an insight...


Via Lauren Moss
Lauren Moss's curator insight, January 8, 2013 4:23 PM

An interesting look at the current role of data visualization and data journalism in the advancement of research, communication, and brand development.

Scott Turner's curator insight, January 9, 2013 8:31 AM

An interesting look at the current role of data visualization and data journalism in the advancement of research, communication, and brand development.

Rescooped by association concert urbain from SocialMediaDesign
Scoop.it!

Curate, Organize and Visualize LARGE Data Collections with TreeMap

Curate, Organize and Visualize LARGE Data Collections with TreeMap | Machines Pensantes | Scoop.it

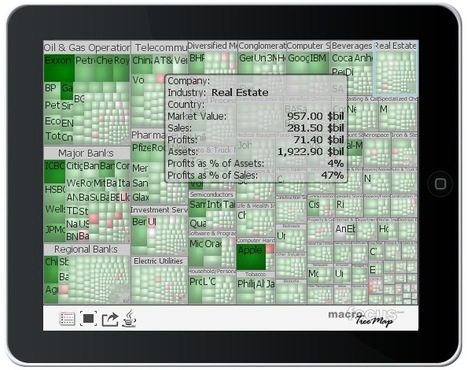
TreeMap provides an easy, yet extremely powerful means of creating beautiful treemaps for analytical and presentation purpose. Importing data from a wide variety of file formats (including of course Excel), as well as connecting to databases (such as MySQL and SQL Server) is a breeze... and it scales to big data. 


Via Robin Good, Jimun Gimm
ghbrett's curator insight, July 18, 2013 9:08 AM

This is another post where I recommend that you scroll down to have a look at Robin Good's great commentary. I can not beat his for details. His Scoop.it site is: http://curation.masternewmedia.org/  Thanks Robin!

Jenifer Rettler's curator insight, July 18, 2013 10:15 AM

If you are looking for additional visualization tools for displaying data, TreeMap v. 3.0 offers a classic tree map layout as well as others, like squarified variant, circular, tag cloud and voronoi.

malek's curator insight, July 18, 2013 4:54 PM

Interesting tool, give it a try

Rescooped by association concert urbain from Complex Insight - Understanding our world
Scoop.it!

A Tour Through the Visualization Zoo

A Tour Through the Visualization Zoo | Machines Pensantes | Scoop.it

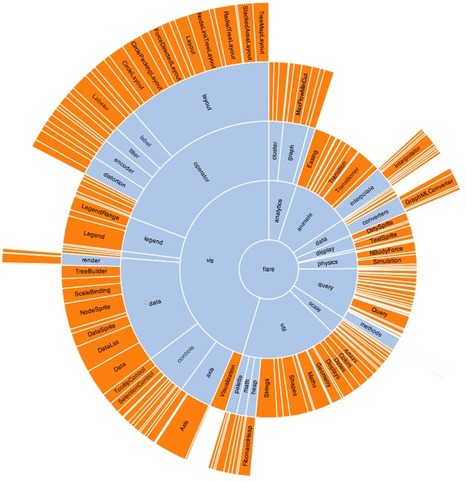
If you ever have to explain which data viz technique to use under what circumstance to someone - then Stanford's Visualization Zoo tour is well worth a few minutes.  The tour showcases techniques for visualizing and interacting with diverse data sets. In many situations, not only will simple data graphics suffice, they may be preferable. However the tour also includes some of the more sophisticated and unusual techniques that have been developed to deal with complex data sets. Well worth reading. Click on the image or the title to learn more


Via Phillip Trotter
No comment yet.