Machines Pensantes
48.2K views | +0 today
Follow
Machines Pensantes
La vie sous toutes ses formes
Your new post is loading...
Rescooped by association concert urbain from Public Relations & Social Marketing Insight
Scoop.it!

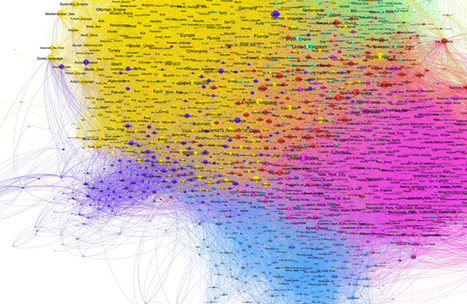
The 37 BEST tools for data visualization

The 37 BEST tools for data visualization | Machines Pensantes | Scoop.it

Not a web designer or developer? You may prefer free tools for creating infographics.


As author, data journalist and information designer David McCandless said in his TED talk: “By visualizing information, we turn it into a landscape that you can explore with your eyes, a sort of information map. And when you’re lost in information, an information map is kind of useful.”


There are many different ways of telling a story, but everything starts with an idea. So to help you get started we’ve rounded up some of the most awesome data visualization tools available on the web....


Via Jeff Domansky
Winners Education's curator insight, March 26, 2015 12:24 PM

Adressing the visula part of the learning brain with easy-to-use, web-dased tools 

Vinicius Vinny Araujo's curator insight, April 17, 2015 12:55 AM

#data

Nora Morton's curator insight, April 22, 2015 6:23 PM

Colorful charts/graphs/maps are my type of eye candy!  This site illustrates the vast ways you can visually present data.  Among the many: iChart, Polymaps, Google Charts, Many Eyes, Leaflet, Exhibit, and Zing Chart. 

Rescooped by association concert urbain from visual data
Scoop.it!

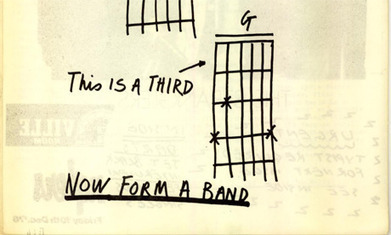
Can anyone be a data journalist? : Anyone can do it. Data journalism is the new punk

Can anyone be a data journalist? : Anyone can do it. Data journalism is the new punk | Machines Pensantes | Scoop.it

Can anyone be a data journalist?

Simon Rogers on what we can learn from a 1977 diagram...


Now is the time to examine this - in May 2010, we published this piece on how reporters would soon be flooded with a "tsunami of data". Two years on and data journalism is part of the fabric of what we, and many other news organisations do.


What is it? I would say data journalism is such a wide range now of styles - from visualisation to long form articles. The key thing they have in common is that they're based on numbers and statistics - and that they should aim to get a 'story' from that data. The ultimate display of that story, be it words or graphics, is irrelevant, I think - it's more about the process...


Via Lauren Moss
No comment yet.
Rescooped by association concert urbain from visual data
Scoop.it!

Data Visualization: Communication & Creativity

Data Visualization: Communication & Creativity | Machines Pensantes | Scoop.it

Visual communication skills are alien to some in the research industry, but they needn’t be. Data visualisation can become part of the research process through smart hiring, skills training and expert partnerships.


Data visualisation should not be regarded as an end in itself; the real point to data visualisation - the value that it brings to research buyers and suppliers - is as an aid to storytelling. It’s about seeing the patterns in the data that flush out a story and then help you to start telling that story. Only by doing that can you move data off the spreadsheet and out into the real world of consumer behaviour and preferences.

The best analogy and the one used frequently, is with journalism. It’s no surprise either that many great examples of data visualisation come from the publishing and media sectors. Journalists face the same challenge that we do of sifting large amounts of often conflicting data to arrive at a truth or an insight...


Via Lauren Moss
Lauren Moss's curator insight, January 8, 2013 4:23 PM

An interesting look at the current role of data visualization and data journalism in the advancement of research, communication, and brand development.

Scott Turner's curator insight, January 9, 2013 8:31 AM

An interesting look at the current role of data visualization and data journalism in the advancement of research, communication, and brand development.