Learning Claris FileMaker
317.5K views | +14 today
Follow
Learning Claris FileMaker
Give life to your data with an easy to use database ... I'll share cool FileMaker stuff for you, avoiding the programming part of it as much as I can.                        #WorkplaceInnovationPlatform #Claris
Your new post is loading...
Scooped by Didier Daglinckx
Scoop.it!

Visualize FileMaker Data in Tableau | Codence | Business

Visualize FileMaker Data in Tableau | Codence | Business | Learning Claris FileMaker | Scoop.it

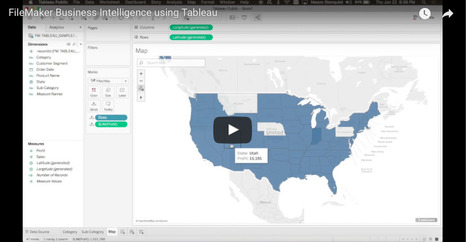
Visualize your FileMaker data in Tableau and get important questions answered in a matter of minutes to help grow and improve your business.


An average FileMaker database contains a large amount of unused, valuable data.

And that data can provide a lot of important insights.


How long does it take to ship an order?

What is our most popular product?

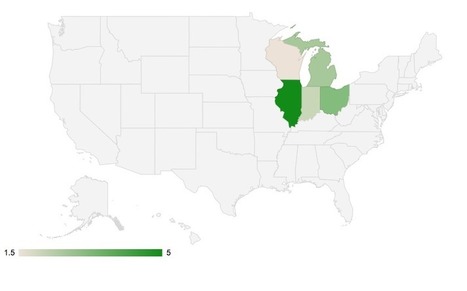
What categories are more profitable than others?


All of these and more are important questions that can be answered in a matter of minutes in Tableau.


The best part?

Unlike Microsoft Power BI, Tableau has a special FileMaker connector that can be used to easily get that data.

With their new flexible pricing and Tableau Desktop 2021’s visualizing power, it’s easier to get the answers you need to help grow and improve your business.


No comment yet.
Scooped by Didier Daglinckx
Scoop.it!

FileMaker and Graph Databases | ClickWorks

FileMaker and Graph Databases | ClickWorks | Learning Claris FileMaker | Scoop.it
How can Facebook, Amazon, LinkedIn and Google provide recommendations in near-real time?


What database engine is used to investigate the Panama papers?


Can we tap into that power with FileMaker?

Sure!


Learn more about the power of so called ‘graph databases’.


I (Joris Aarts) use the most popular one — Neo4j — as an example and show you step by step how to integrate a graph database in a FileMaker solution.

No comment yet.
Scooped by Didier Daglinckx
Scoop.it!

Google Charts in FileMaker | DB services - video

Google Charts in FileMaker | DB services - video | Learning Claris FileMaker | Scoop.it

FileMaker offers many different options for charting, but if you need a chart that is not available in FileMaker, you should consider using Google Charts.


Google Charts is a free Javascript framework that can be used in conjunction with web viewers in FileMaker to extend your charting capabilities.

Since native FileMaker charting is much quicker and simpler to set up, let’s look at some Google Charts.

Only Available in Google Charts

  • Geographic
  • Candlestick
  • Organizational
  • Treemap
  • Gauge
  • Timeline


No comment yet.
Scooped by Didier Daglinckx
Scoop.it!

yFiles for HTML brings diagramming to your HTML5 applications | FileMaker idea

yFiles for HTML brings the proven power and ease of yFiles diagramming to your HTML5 applications.


The JavaScript / HTML5 solution features advanced UI controls for viewing and editing diagrams and unequaled graph layout algorithms for automatically arranging complex diagrams at the click of a button.


No comment yet.
Scooped by Didier Daglinckx
Scoop.it!

How Designers Do It: 15 Easy Steps To Design an Infographic From Scratch | Design School - FileMaker tip

How Designers Do It: 15 Easy Steps To Design an Infographic From Scratch | Design School - FileMaker tip | Learning Claris FileMaker | Scoop.it
How Designers Do It: 15 Easy Steps To Design an Infographic From Scratch
Have you ever had a TON of information you needed to get out but don’t know how to do it effectively?

Fret no longer. Today you will learn how to relay mass amounts of information in an effective, beautiful way. That’s right, we’re talking infographics.
Scooped by Didier Daglinckx
Scoop.it!

How to Make Your Data Pretty? Utilize These Data Visualization Tools | FileMaker Inspiration

How to Make Your Data Pretty? Utilize These Data Visualization Tools | FileMaker Inspiration | Learning Claris FileMaker | Scoop.it
Tired of showcasing the same old boring tables to your management? A spice of colors and layout brings life to data representation. If you need to understand million rows of data and you are short on…
No comment yet.
Scooped by Didier Daglinckx
Scoop.it!

FileMaker's Easiest Charting Program

FileMaker's Easiest Charting Program | Learning Claris FileMaker | Scoop.it

fmEZCharts is the easiest and most powerful way to add beautiful charts and graphs to your FileMaker Pro systems.

Easy to integrate. Intuitive to use.

Build beautiful Javascript charts and graphs with no experience needed.

The community based support forum provides a place to ask and answer questions about integration, troubleshooting, and general questions about use.

Watch the video to learn more

No comment yet.
Scooped by Didier Daglinckx
Scoop.it!

Intro to Neo4j, the Graph Platform | YouTube

Ryan Boyd, Developer Relations, Neo4j:In this introduction to Neo4j and Graph Databases, we discuss the primary use cases for Graph Databases and explore the properties of Neo4j that make those use cases possible.
No comment yet.
Scooped by Didier Daglinckx
Scoop.it!

FileMaker Business Intelligence Using Tableau

FileMaker Business Intelligence Using Tableau | Learning Claris FileMaker | Scoop.it

FileMaker Business Intelligence Using Tableau


With FileMaker 16 you are now able to connect to a powerful business intelligence software called Tableau that helps people see and understand their data.


Tableau is a leader in business intelligence software and has been named a leader 5 years in a row in Gartner’s Magic Quadrant. Tableau allows you to create advanced charts and reports of your data, and create interactive dashboards that let you see trends and turn data into actionable insights.

With FileMaker’s new REST API connecting to Tableau is easier than ever.


Read more on DB Services blog ...

Didier Daglinckx's insight:

More about Tableau and FileMaker : http://www.scoop.it/t/learning-filemaker?q=tableau


and


FileMaker help : FileMaker Data API integration with Tableau

https://fmhelp.filemaker.com/docs/16/en/restapi/#filemaker-data-api-tableau

No comment yet.
Scooped by Didier Daglinckx
Scoop.it!

Filemaker Pro - Graphs and Charts | Youtube (1:11:19)

A few different ways to add graphs to your Filemaker Pro Solutions

No comment yet.
Scooped by Didier Daglinckx
Scoop.it!

The 37 best tools for data visualization | FileMaker tools

The 37 best tools for data visualization | FileMaker tools | Learning Claris FileMaker | Scoop.it
Creating charts and info graphics can be time-consuming. But these tools make it easier.

It’s often said that data is the new world currency, and the web is the exchange bureau through which it’s traded.


As consumers, we’re positively swimming in data; it’s everywhere from labels on food packaging design to World Health Organisation reports.

As a result, for the designer it’s becoming increasingly difficult to present data in a way that stands out from the mass of competing data streams.


One of the best ways to get your message across is to use a visualization to quickly draw attention to the key messages, and by presenting data visually it’s also possible to uncover surprising patterns and observations that wouldn’t be apparent from looking at stats alone.


...


Explore the different possibilities on analyticsweek.com post ...

Didier Daglinckx's insight:

FileMaker offers graphics you can use quite easily but if you want/need to go further a combination of FileMaker and one of the tools describe here can be pretty awesome.

James J. Goldsmith's curator insight, March 24, 2015 9:42 AM

Some useful tools for making data understandable in your presentations.