


 Your new post is loading...

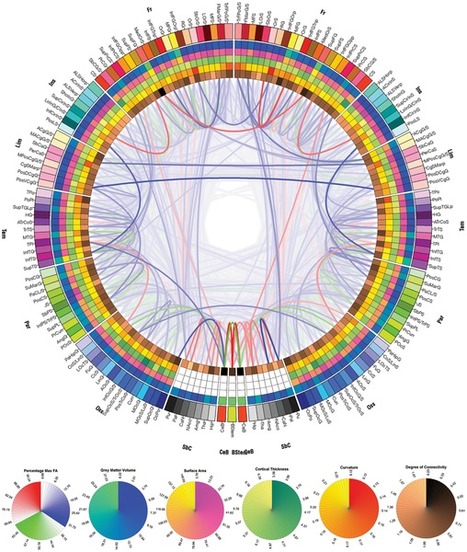

The point is to show how advances in imaging and data visualization technologies enable inter-disciplinary research which just a decade ago would have been impossible to conduct. There is also a somewhat artistic quality to these images, which reinforces the notion of data visualization being both art and science.
Via Sakis Koukouvis, Wildcat2030


