Le BONHEUR comme indice d'épanouissement social et économique.
50.1K views | +0 today
Follow
Le BONHEUR comme indice d'épanouissement social et économique.
Le bonheur c'est comment on fait pour vivre ensemble
Your new post is loading...
Rescooped by association concert urbain from green infographics
Scoop.it!

Near-REAL-TIME monitoring: Global Forest Watch

Near-REAL-TIME monitoring: Global Forest Watch | Le BONHEUR comme indice d'épanouissement social et économique. | Scoop.it

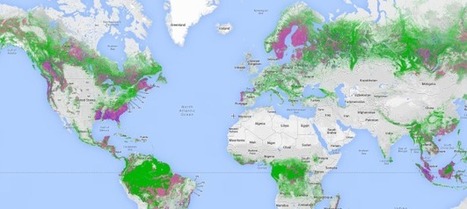
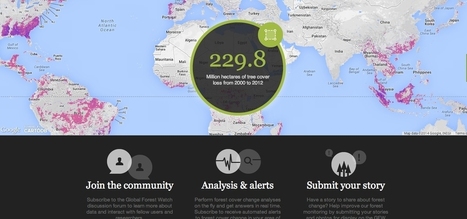
Global Forest Watch uses satellite imagery and other technologies to estimate forest usage, change, and tree cover (among other things). These estimates and their eventual actions used to be slow. Now they're near-real-time.

The online forest monitoring system created by the World Resources Institute, Google and a group of more than 40 partners uses technologies including Google Earth Engine and Google Maps Engine to map the world’s forests with satellite imagery, detect changes in forest cover in near-real-time, and make this information freely available to anyone with Internet access.


Via Lauren Moss
Ma. Caridad Benitez's curator insight, March 18, 2014 10:18 AM

When reality is worst than fiction!

Rescooped by association concert urbain from green infographics
Scoop.it!

The Happiest Cities in the World [Infographic]

The Happiest Cities in the World [Infographic] | Le BONHEUR comme indice d'épanouissement social et économique. | Scoop.it

Happiness is a fleeting commodity in reality, it comes and goes, but the perception of happiness is the real bottom-line driver for cities and their branding.


What makes urban dwellers happy? According to a 10,000 respondent, 20 country research effort from GfK Custom Research, it is a location-based perception: does your city offer you places to go that make you happy? Apparently, the perception-reality gap is what is really interesting the city governments. Happiness is a fleeting commodity in reality, it comes and goes, but the perception of happiness is the real bottom-line driver for cities and their branding.

The winning locations end up being quite obvious candidates; entertainment and cultural heavyweights, beautiful urban areas and laid-back lifestyles lead the march...

See more statistics and data at the infographic and article link.


Via Lauren Moss
bancoideas's curator insight, March 4, 2013 9:51 AM

Ciudades felices y ciudades inteligentes son #ideas que siempre deben ir de la mano #smartcities, no te pierdas esta #inforgrafía

Rescooped by association concert urbain from green infographics
Scoop.it!

Google's Next Goal: To STOP Deforestation with Global Forest Watch

Google's Next Goal: To STOP Deforestation with Global Forest Watch | Le BONHEUR comme indice d'épanouissement social et économique. | Scoop.it

Deforestation has long been cited as a problem, but a lack of accessible data meant that the general public had to take someone's word for the figures. As a result, its threat always seemed more abstract and nebulous than, say, climate change or rising sea levels.


Until now: Google has unveiled its Global Forest Watch, an online tool that monitors deforestation around the world in near-real time.


Via Lauren Moss
Antonio Lopez's curator insight, February 28, 2014 6:05 AM

One role of media should be to act like those speed monitors we see that tell us how fast we are going. Hopefully a program like Google's Global Forest Watch can help us monitor deforestation in real time.

thinking peasant's curator insight, February 28, 2014 6:51 AM

maybe they have not gone over to the dark side for good?

Daniel LaLiberte's comment, March 10, 2014 11:59 AM
Another writeup at: http://www.bbc.com/news/science-environment-26287137
Rescooped by association concert urbain from visual data
Scoop.it!

What Is Visualization?

What Is Visualization? | Le BONHEUR comme indice d'épanouissement social et économique. | Scoop.it

This seems like a straightforward question, but it’s proven to be a difficult one to answer. Even visualization researchers – people who think about the subject all day and every day – don’t have a clear definition of what visualization is. Is it synonymous with information graphics? Does visualization have to be computer generated? Does data have to be involved, or can it be abstract? The answers vary depending on who you ask.

To me, visualization is a medium. It’s not just an analysis tool nor just a way to prove a point more clearly through data.

Visualization is like books. There are different writing styles and categories, there are textbooks and there are novels, and they communicate ideas in different ways for varied purposes. And just like authors who use words to communicate, there are rules that you should always follow and others that are guidelines that you can bend and break...


Via Lauren Moss
Fàtima Galan's curator insight, September 12, 2013 6:50 AM

"Visualization is like books. There are different writing styles and categories, there are textbooks and there are novels, and they communicate ideas in different ways for varied purposes. "

Patrice Mitrano's curator insight, January 30, 2014 5:16 AM

De très nombreux exemples d'infographies, malheureusement pas toujours aboutis. A croiser avec d'autres infographies ou représentations sur des sujets identiques ou bien à rapprocher des données sources.

Sang Lee's curator insight, June 17, 2014 9:57 PM

Visualization