JavaScript for Line of Business Applications
596.1K views | +0 today
Follow
JavaScript for Line of Business Applications
Keeping track of current JavaScript Frameworks that help design your clientside Business Logic Layers.
Curated by Jan Hesse
Beam to my Inbox:
Your new post is loading...

Popular Tags - Filter using the Funnel

Current selected tag: 'D3'. Clear
Scoop.it!

Reusable Chart Components with React And D3

Reusable Chart Components with React And D3 | JavaScript for Line of Business Applications | Scoop.it

The following should be an introduction to combining D3 with React to create reusable chart components. This is not intended to be an introduction into D3 nor React.

D3s approach to data visualization fits well with the React way of building UI components and App structuring. React encourages to figure out how to structure a number of components to enforce a data flow that moves from top down, meaning that lower level components receive data and render it at best and only keep state if needed, but never manipulating any data that might affect the higher up components.

Another strong correlation between the libraries is their respective component lifecycle. D3 has enterupdate and exit.


No comment yet.
Scoop.it!

Working with SVG in Ember

Working with SVG in Ember | JavaScript for Line of Business Applications | Scoop.it

At the time of this post, working with SVG in Ember can be a PITA to say the least.

The issues faced in Ember with SVG are the same issues faced by most frameworks. In fact, as of right now (now meaning while I'm typing this), there are no stable versions of JavaScript "frameworks" that fully support SVG properly. Angular, Ember, React and Polymer all have some pain around handling SVG. Some of them attempt to handle it, React for example, but there are certain cases where it will still break.

No comment yet.
Scoop.it!

Integrating D3.js visualizations in a React app

Integrating D3.js visualizations in a React app | JavaScript for Line of Business Applications | Scoop.it

A small example exploring how to integrate D3.js data visualizations into a React app.

I think that using React and D3.js together makes sense because they share a common philosophy of "give me a set of data, tell me how it should be rendered, and I'll figure out which parts of the DOM to update for you". Indeed, React has its virtual DOM diffs, and D3.js has its update selections, making both quite efficient in the business of keeping the UI in sync with data changes.

I find that making D3 components play nice inside a React app becomes easier when you follow these simple guidelines: ...

Scoop.it!

PojoViz - Plain Old JavaScript Object Visualization

PojoViz - Plain Old JavaScript Object Visualization | JavaScript for Line of Business Applications | Scoop.it

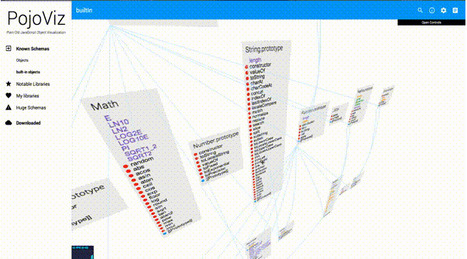
PojoViz is a tool to analyze the plain objects of a JavaScript library/framework by finding all the relationships found between the library entry point (typically a global variable) and the objects/functions linked to it.

No comment yet.
Scoop.it!

n3-charts: Versatile charts for AngularJS

n3-charts: Versatile charts for AngularJS | JavaScript for Line of Business Applications | Scoop.it

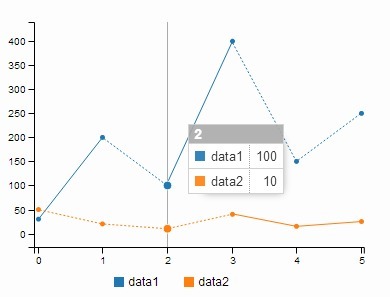
Built on top of D3.js and AngularJS, n3-charts.line-chart directive creates beautiful charts in AngularJS applications. It is simple and interactive.

Jan Hesse's insight:

https://github.com/n3-charts/line-chart

No comment yet.
Scoop.it!

vis.js | a dynamic, browser-based visualization library

vis.js | a dynamic, browser-based visualization library | JavaScript for Line of Business Applications | Scoop.it

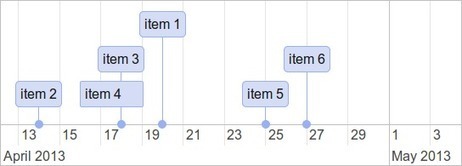
Vis.js is a dynamic, browser based visualization library. The library is designed to be easy to use, to handle large amounts of dynamic data, and to enable manipulation of and interaction with the data. The library consists of the components DataSet, Timeline, and Graph.

No comment yet.
Scoop.it!

Using webcomponents in D3.js

Using webcomponents in D3.js | JavaScript for Line of Business Applications | Scoop.it

This post describes a prototype that uses Polymer webcomponents in D3.js.

Appending a single element, like a ‘rect’ to a D3 selection is straightforward. But when you want to append a more complex, nested structure to a selection, it would be nice if you could append a renderer or template. And I would find it even more comfortable if you could specify this in a structured language like xml/html. Furthermore, I would like to specify the behaviour of this renderer within the renderer itself.

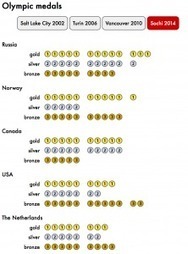
I first encountered this desire when I tried to use D3 for visualizing Isotype charts. D3 maps data points to dom elements in a one-to-one relation, while Isotype maps data points to dom elements in a one-to-many relation. You can solve this by converting data points to arrays, but that feels a bit hackish.

I decided to use webcomponents.

No comment yet.
Scoop.it!

D3 and React - the future of charting components?

D3 and React - the future of charting components? | JavaScript for Line of Business Applications | Scoop.it

Inspiration for combining React with D3 came from reading the following two blog posts where AngularJS was used as a part replacement for D3.

* Replacing (most of) d3.js with pure SVG + AngularJS
* Screw D3.js, Bar Charts in AngularJS


In these articles, AngularJS was used to manipulate the SVG elements, rather than D3.js. It had been relegated to providing the axis scales, calculating shape dimensions and path coordinates.

I was convinced that React could take Angular's place. Bringing with it the benefits of the web component style charting tags that the JSX syntax would allow me to create.

This would allow me to specify my chart component in the domain and terms of charting: Chart, Bar, Line and DataSeries. Rather than the actual implementation detail of SVG elements such as g, path, rect.

No comment yet.
Scoop.it!

Sigma.js | dedicated to graph drawing

Sigma.js | dedicated to graph drawing | JavaScript for Line of Business Applications | Scoop.it

Sigma is a JavaScript library dedicated to graph drawing. It makes easy to publish networks on Web pages, and allows developers to integrate network exploration in rich Web applications.

Sigma provides a lot of built-in features, such as Canvas and WebGL renderers or mouse and touch support, to make networks manipulation on Web pages smooth and fast for the user.

Sigma provides a lot of different settings to make it easy to customize how to draw and interact with networks. And you can also directly add your own functions to your scripts to render nodes and edges the exact way you want.

Sigma is a rendering engine, and it is up to you to add all the interactivity you want. The public API makes it possible to modify the data, move the camera, refresh the rendering, listen to events...


No comment yet.
Scoop.it!

Fast interactive prototyping with Sketch and d3.js

Fast interactive prototyping with Sketch and d3.js | JavaScript for Line of Business Applications | Scoop.it

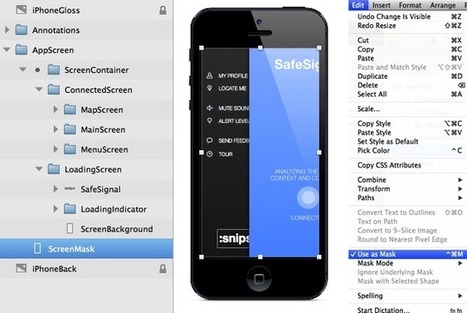
In this post, I want to share how we quickly develop interactive prototypes, by designing SVG content in graphical apps like Sketch and scripting them usingd3.js. The prototypes can then be shared on the web or installed as apps on a device. This allows us to quickly get how an app will feel in the hand of users.

In this post, I want to present the approach we've taken at Snips which to us seems to hit the perfect sweet spot: designing the app as SVG and adding complex interactions with d3.js.


Here are a few benefits of this approach from my vantage point:
* design the app with your favorite graphical tools (Sketch, Inkscape, Illustrator, ...gVim)
* fast iterations: animating SVG elements is far faster than implementing complex UI code for Android or iOS, but allows for almost everything that you would need: bouncy motion, * transparency, shadows, transforms etc.
share prototypes on the web or show them directly on a device (we show you how in a follow-up post!)
* most importantly be the cool kid using SVG and d3.js

This post will very quickly get to the gist of the approach, then describe my workflow with Sketch and d3.js.


No comment yet.
Scoop.it!

Dynamic D3 with Knockout.js

Dynamic D3 with Knockout.js | JavaScript for Line of Business Applications | Scoop.it

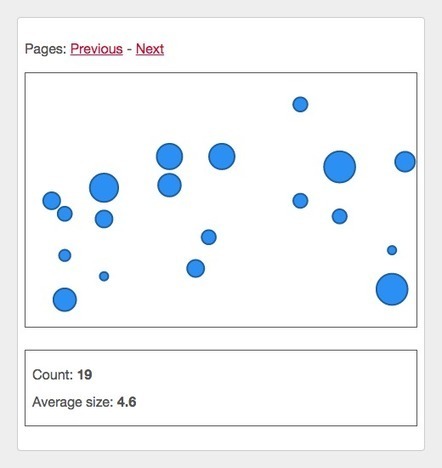
So, how can we combine these two immensely powerful libraries to do something interesting? Or at least vaguely interactive.

Let’s see if we can use D3 to draw some rectangles, described in a Knockout view-model, which we can modify using D3 or by altering the data itself.

There is some overlap in functionality here: KO enables us to generate DOM content based on data, as does D3. In theory we could use a KO template to generate fragments of SVG markup for each of our view models. But that would involve generating the elements long-hand and we wouldn’t have the association between view and view-model.

Now, we need a way of getting the KO data fed to D3 at the right time: when it’s updated.

One of the first things to notice is that if we observe the array of rects, we only see changes to the array, not to its elements. In other words, we only know when items are added or removed, not when elements properties are changed. Seeing as we need to know when a rectangle’s position changes, we’ll need to do some more work.

- See more at: http://www.voyce.com/index.php/2013/06/23/dynamic-d3-with-knockout-js/#sthash.IDxcsa5W.dpuf

No comment yet.
Scoop.it!

Building D3 Bar Chart for Angular

Building D3 Bar Chart for Angular | JavaScript for Line of Business Applications | Scoop.it

D3 a very powerful tool and at times can be a bit overwhelming. Today I would like to simplify things by walking you through building a bar chart using D3.

First step is to create a barChart directive.

It will will take an data array and add a svg tag to our element. We will using this svg to build our chart.

D3 allow us to resize our data to the portions of the SVG using d3.scale. We tell the scale the upper and lower bounds of the dataset using domain and the upper and lower bounds of the chart using range. Using x and y functions generated from d3.scale.linear(), we can then place bars in the right spot on the SVG.

No comment yet.
Scoop.it!

Why we use D3 and Ember for Data Visualization

Why we use D3 and Ember for Data Visualization | JavaScript for Line of Business Applications | Scoop.it

When visualizing data on the web, there are two things that we need to think of, the DATA and the DOM.

D3 is the go-to visualization library because it’s a flexible and data-driven approach to DOM manipulation; D3 does the complicated math so we can think more about data and visualization.

Ember is a MVC javascript framework for creating ambitious web applications. But, why should we use Ember with D3 for DATA and DOM manipulation? Ember gives you tools to easily manage things like async requests and the MVC architecture helps to manage complexity.

No comment yet.
Scoop.it!

Data Visualization with JavaScript

Data Visualization with JavaScript | JavaScript for Line of Business Applications | Scoop.it

If you’re developing web sites or web applications today, there’s a good chance you have data to communicate, and that data may be begging for a good visualization. But how do you know what kind of visualization is appropriate? And, even more importantly, how do you actually create one? Answers to those very questions are the core of this book. In the chapters that follow, we explore dozens of different visualizations and visualization techniques and tool kits. Each example discusses the appropriateness of the visualization (and suggests possible alternatives) and provides step-by-step instructions for including the visualization in your own web pages.


Contents:

  1. Introduction
    1. Implementation vs Design
    2. Code vs. Styling
    3. Simple vs. Complex
    4. Reality vs. an Ideal World
    5. Source Code for Examples
    6. Acknowledgements
  2. Graphing Data
  3. Making Charts Interactive
  4. Integrating Charts in a Page
  5. Creating Specialized Graphs
  6. Showing Timelines
  7. Visualizing Geographic Data
  8. Custom Visualizations with D3.js
  9. Building Data-Driven Web Applications
  10. Managing Data in the Browser


No comment yet.
Scoop.it!

Building a D3 Plugin

Building a D3 Plugin | JavaScript for Line of Business Applications | Scoop.it

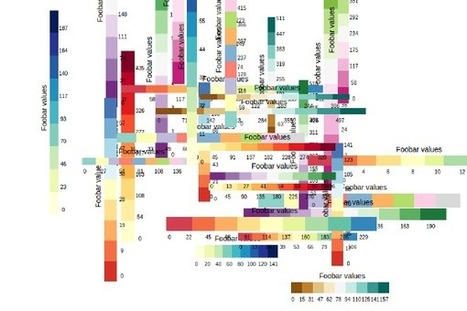
Some awkward, common visualization constructs lend themselves to a plugin form, a reusable DOM-stamper that can be applied to an ‘svg’ or ‘div’ tag, with a few parameters and maybe some data. For example take a colorbar or legend-box, often unglamorous visual indicators which are tedious to repeat from scratch. I’ve been trying to make writing such things easier, limiting the initial boilerplate and focussing on the D3 build stage. What follows is my current state of play, with inspiration from Mike Bostock’s article on reusable charts  among others. Very much a work in progress.

No comment yet.
Scoop.it!

C3.js | D3-based reusable chart library

C3.js | D3-based reusable chart library | JavaScript for Line of Business Applications | Scoop.it

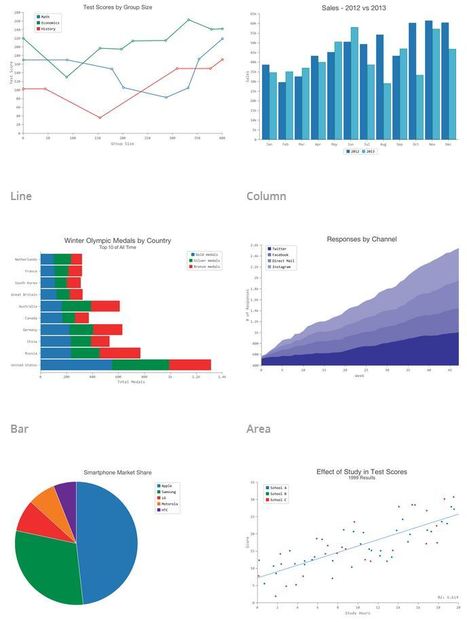
C3 makes it easy to generate D3-based charts by wrapping the code required to construct the entire chart. We don't need to write D3 code any more.

No comment yet.
Scoop.it!

Visualizing Algorithms with JavaScript Samples

Visualizing Algorithms with JavaScript Samples | JavaScript for Line of Business Applications | Scoop.it

Algorithms are a fascinating use case for visualization. To visualize an algorithm, we don’t merely fit data to a chart; there is no primary dataset. Instead there are logical rules that describe behavior. This may be why algorithm visualizations are so unusual, as designers experiment with novel forms to better communicate. This is reason enough to study them.

But algorithms are also a reminder that visualization is more than a tool for finding patterns in data. Visualization leverages the human visual system to augment human intellect: we can use it to better understand these important abstract processes, and perhaps other things, too.

Jan Hesse's insight:

fine reading with lots of examples on ordering and randomness

No comment yet.
Scoop.it!

Contour: Interactive JavaScript Charts for Data Visualization

Contour: Interactive JavaScript Charts for Data Visualization | JavaScript for Line of Business Applications | Scoop.it

Forio Contour provides a core set of common visualizations that you can see in the gallery, and it's easy to extend if you want to add your own customizations. Plus, it's free and open source.

Forio Contour uses the popular D3 engine and adds a set of intuitive abstractions so you can easily create graphs and charts.

No comment yet.
Scoop.it!

Learn how to make Data Visualizations with D3.js | DashingD3js.com

Learn how to make Data Visualizations with D3.js | DashingD3js.com | JavaScript for Line of Business Applications | Scoop.it
Welcome to DashingD3js.com - a website full of D3 Tutorials, D3 Screencasts and a D3 Newsletter.


* Why Data Visualizations
* Why build Data Visualizations with D3.js
* The Data Visualization Process
* Basic Building Blocks
* D3.js First Steps
* Adding a DOM element
* Adding an SVG element
* Binding Data to DOM Elements
* Using Data Bound to DOM Elements
* Creating SVG Elements Based on Data
* Using the SVG Coordinate Space
* Data Structures D3.js Accepts
* Using JSON to Simplify Code
* SVG Basic Shapes and D3.js
* SVG Paths and D3.js
* Dynamic SVG Coordinate Space
* D3.js Scales
* SVG Group Element and D3.js
* SVG Text Element
* D3.js Axes

Jan Hesse's insight:

for D3 with Angular see: https://www.dashingd3js.com/d3-resources/d3-and-angular

No comment yet.
Scoop.it!

D3 Tutorials

D3 Tutorials | JavaScript for Line of Business Applications | Scoop.it

These tutorials evolved out of my own process of learning how to use D3. You already know that D3 is an extraordinary tool for mapping data within web pages, written by Mike Bostock. Many people, including myself, come to D3 with backgrounds in design, mapping, and data visualization, but not programming and computer science.

Yet D3 employs advanced JavaScript techniques, so learning to use D3 often means learning a lot about JavaScript. For many datavis folks, D3 is their introduction to JavaScript. It’s hard enough to learn a new programming language, let alone a new tool built on that language. D3 is amazing and will enable you to do great things with JavaScript that you never would have even attempted. The time you spend learning both the language and the tool will provide an incredible payoff.

My goal is to reduce that learning time, so you can start creating awesome stuff sooner.


* Fundamentals
* Setup
* Adding elements
* Chaining methods
* Binding data
* Using your data
* Drawing divs
* The power of data()
* An SVG primer
* Drawing SVGs
* Types of data
* Making a bar chart
* Making a scatterplot
* Scales
* Axes

No comment yet.
Scoop.it!

Cytoscape.js - A JavaScript graph library for analysis and visualisation

Cytoscape.js - A JavaScript graph library for analysis and visualisation | JavaScript for Line of Business Applications | Scoop.it

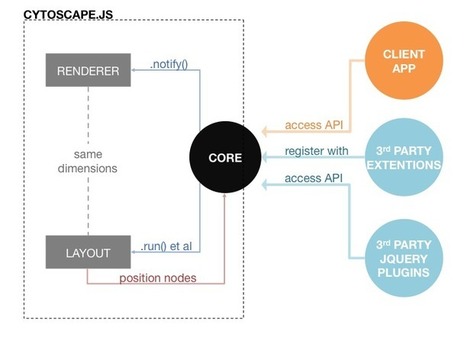
Cytoscape.js is an open-source graph library written in JavaScript. You can use Cytoscape.js for graph analysis and visualisation.

Cytoscape.js allows you to easily display graphs in your websites. Because Cytoscape.js allows the user to interact with the graph and the library allows the client to hook into user events, Cytoscape.js is easily integrated into your webapp, especially since Cytoscape.js supports both desktop browsers, like Chrome, and mobile browsers, like on the iPad.

Cytoscape.js also has graph analysis in mind: The library contains a slew of useful functions in graph theory. You can use Cytoscape.js headlessly on Node.js to do graph analysis in the terminal or on a web server.

Muhammad's curator insight, March 6, 2019 3:38 PM
Share your insight
Scoop.it!

Vega: A Visualization Grammar

Vega: A Visualization Grammar | JavaScript for Line of Business Applications | Scoop.it
Vega is a visualization grammar, a declarative format for creating, saving and sharing visualization designs.
With Vega you can describe data visualizations in a JSON format, and generate interactive views using either HTML5 Canvas or SVG.
No comment yet.
Scoop.it!

D3.js: How to handle dynamic JSON Data

D3.js: How to handle dynamic JSON Data | JavaScript for Line of Business Applications | Scoop.it

When I started with d3.js, I really struggled understanding how I could link data from a JSON feed to a SVG graph. I read a lot of tutorials but still, I couldn't find what I was looking for. Now that I know how d3.js behaves, I thought it would a good idea to share the things that I learned.

When you start using the library, there's stuff that might be foreign to you:

* It uses SVG which many of us have no experience with.

* SVG has an opposite y-coordinate system (0 is on top, height() is at the bottom).

* stroke, fill, clipping, etc.

My goal was to create a dynamic graph that I could add, edit and remove data and have d3 update the graph in real time but I couldn't understand how to handle enter() and exit() with JSON. Many examples out there were done using static data so it wasn't covering my issues with JSON.

Throughout this post, I will be using this response as an example of a JSON response to show you how to represent your JSON into a graph.

No comment yet.
Scoop.it!

Making Dashboards with Dc.js - Part 1: Using Crossfilter.js

Making Dashboards with Dc.js - Part 1: Using Crossfilter.js | JavaScript for Line of Business Applications | Scoop.it

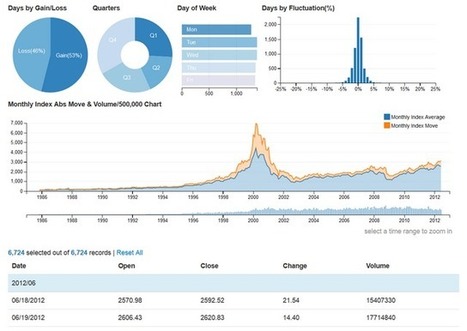
Dc.js is a JavaScript library used to make interactive dashboards in JavaScript. By clicking and selecting different events in graphs, you can filter the entire dashboard to drill into a particular event.

In order to do this, DC.js relies on two other JavaScript plugins/libraries: D3.js and Crossfilter js.

With this first art we're going to start off with how Crossfilter works because most of the actual dashboard code is manipulating the data for the charts. Once you have a good understanding of how that works, the actual graphing is pretty simple. I'm going to try to cover several different scenarios, so you can hopefully avoid some of the pitfalls as you start to use it.

No comment yet.
Scoop.it!

Twitter + GeoJSON + d3.js + Rob Ford = Fun with data visualizations

As a citizen of Toronto, the past few weeks (and months) have been interesting to say the least. Our mayor, Rob Ford, has made headlines for his various lewd remarks, football follies, and drunken stupors. With an election coming up in 2014, I was curious as to how the rest of Toronto felt about our mayor.


The Task

Collect data from Twitter, making sure we only use tweets from people in Toronto. Plot those tweets on an electoral map of Toronto’s wards, colour coding the wards based on how they voted in the 2010 Mayoral Election.


The Tools

* Repustate’s API (for data mining Twitter and extracting sentiment, of course!)

* Shapefiles for the City of Toronto including boundaries for the wards

* GDAL

* d3.js

* jQuery

Jan Hesse's insight:

Using Twitter, GeoJSON (via GDAL) and d3 to visualize data about Rob Ford

No comment yet.