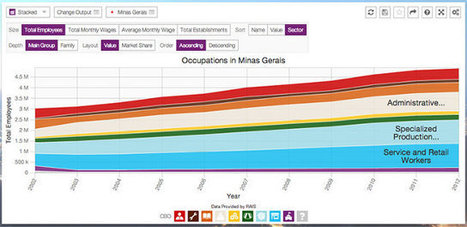
DataViva, a project developed in part by Media Lab professor Csar Hidalgo, aims to make a wide swath of government economic data usable with a series of visualization apps.
In the four years since the U.S. government created data.gov, the first national repository for open data, more than 400,000 datasets are available online from 175 agencies. Governments all over the world have taken steps to make data more transparent and available. But in practice, much of that data--accessible as spreadsheets through sites like data.gov--is incomprehensible to the average person.
DataViva offers web apps that turn those spreadsheets into something more comprehensible for the average user. The site, which officially launched last week, has lofty goals: to visualize data encompassing the entire Brazilian economy over the last decade, with more than 100 million interactive visualizations that can be created at the touch of a button in a series of apps. The future of open government isn't just dumping raw datasets onto a server: It's also about making those datasets digestible for a less data-savvy public.
Via
Lauren Moss


 Your new post is loading...


aggiungi la tua intuizione ...