


Research and publish the best content.
Get Started for FREE
Sign up with Facebook Sign up with X
I don't have a Facebook or a X account
Already have an account: Login

WEBOLUTION!
5.8K views |
+0 today

 Your new post is loading...
 Your new post is loading...
Your new post is loading...
![Smart Grid – Where Power is Going [infographic] | WEBOLUTION! | Scoop.it](https://img.scoop.it/dylR2gPuxwkwSCw0lKarazl72eJkfbmt4t8yenImKBVvK0kTmF0xjctABnaLJIm9)
Why should an everyday homeowner care that the smart grid can increase the U.S. electric grid's efficiency by 9 percent? And what does that amount to in terms of energy and monetary savings? This infographic visually highlights those savings and what they actually mean to consumers.
The effort aims to connect the consumer with the smart grid, by explaining it simply and driving home the many benefits of smart grid technology, including: cost savings, energy efficiency, improved outage detection and resolution, as well as environmental benefits,. “By highlighting the conveniences and benefits the smart grid can bring to consumers, the SGCC and its members can help consumers understand the smart grid just as they understand other, consumer-friendly, ‘smart’ technologies they wouldn’t consider living without – such as a smart phone, computer or television.” Via Lauren Moss 
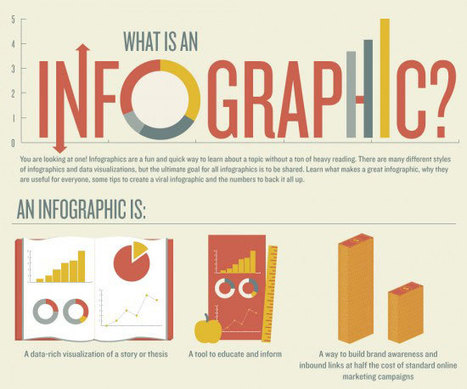
There are many different styles of infographics and data visualizations, but the ultimate goal for all infographics is to be shared. Infographics are a fun and quick way to learn about a topic without a ton of heavy reading.bLearn what makes a great infographic, why they are useful for everyone, some tips to create a viral infographic and the numbers to back it all up... Via Lauren Moss
|
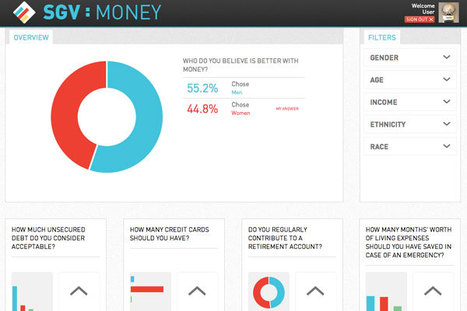
The idea of a Socially Generative Visualization originated out of a section of the design handbook INFOGRAPHICS. Via Lauren Moss

From
ht

Let’s be honest, we don’t like to read big pieces of text. Text-heavy graphs are rather difficult for understanding, especially when dealing with numbers and statistics. That is why illustrations and flowcharts are often used for such kind of information. An infographic, or a visual representation of study or data, like anything else, can be done right or wrong. How to create a successful infographic? A good idea and a good design.
Stop by the link for more on what defines an infographic, what contributes to its popularity, as well as the various types of infographics and references for tutorials and best practices.
Additional topics covered include: The major parts of an infographic How to create an infographic Developing ideas & organizing data Research & sources Typography, graphics & color Facts & conclusions Designing & Editing Via Lauren Moss, Monique Walhof, THE OFFICIAL ANDREASCY
|


Thanks to Nic Hardisty