

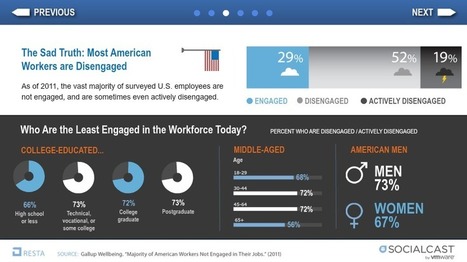

There's no denying infographics are great to communicate data in an engaging, easy to understand way.
Via Baiba Svenca, EiriniKaragiorgaki, Informatics, Gust MEES
Get Started for FREE
Sign up with Facebook Sign up with X
I don't have a Facebook or a X account


 Your new post is loading...
 Your new post is loading...
Your new post is loading...
There's no denying infographics are great to communicate data in an engaging, easy to understand way. Via Baiba Svenca, EiriniKaragiorgaki, Informatics, Gust MEES
Alfredo Corell's insight:
Very interesting and easy to follow...

|
Information graphics, visual representations of data known as infographics, keep the web going these days. Web users, with their diminishing attention spans, are inexorably drawn to these shiny, brightly coloured messages with small, relevant, clearly-displayed nuggets of information. They’re straight to the point, usually factually interesting and often give you a wake-up call as to what those statistics really mean. Via Juanmi Muñoz
|


Very interesting and easy to follow...
Very interesting and easy to follow...