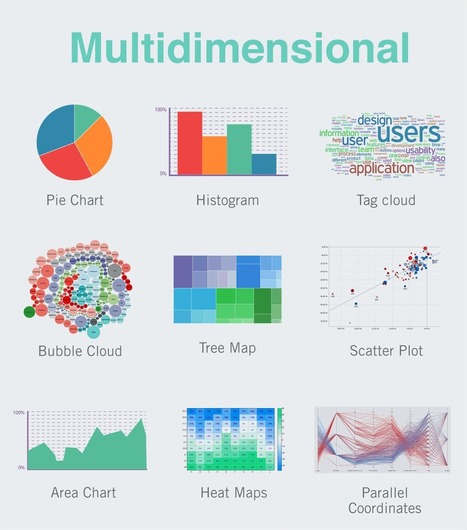
Visualizing data is sometimes the best way to effectively communicate your message especially when it comes to complex data that requires a lot of explanation.
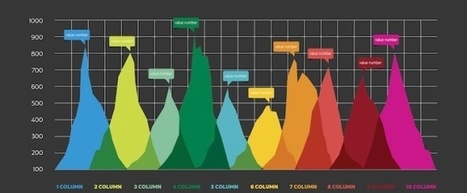
Here we ask you to identify which tool was used to produce the following 18 charts: 4 were done with R, 3 with SPSS, 5 with Excel, 2 with Tableau, 1 with Matla…
Get infographic presentation slides for PowerPoint, Keynote and Google Slides designed by Adioma team. Fully editable and customizable. Make your next presentation in minutes.
Whether you’re writing a blog post, putting together a presentation, or working on a full-length report, using data in your content marketing strategy is a must. Using data helps enhance your arguments by make your writing more compelling. It gives your readers context. And it helps provide support for your claims.
Here we ask you to identify which tool was used to produce the following 18 charts: 4 were done with R, 3 with SPSS, 5 with Excel, 2 with Tableau, 1 with Matla…
To get content containing either thought or leadership enter:
To get content containing both thought and leadership enter:
To get content containing the expression thought leadership enter:
You can enter several keywords and you can refine them whenever you want. Our suggestion engine uses more signals but entering a few keywords here will rapidly give you great content to curate.

 Your new post is loading...

![How to Create Pictographs and Icon Arrays in Visme [New Feature] | Information and digital literacy in education via the digital path | Scoop.it](https://img.scoop.it/ivsQk4B2JVxc4t1mQPUrODl72eJkfbmt4t8yenImKBVvK0kTmF0xjctABnaLJIm9)