Information and digital literacy in education via the digital path
77.9K views | +0 today
Follow
Information and digital literacy in education via the digital path
Literacy in a digital education world and peripheral issues.
Your new post is loading...

Popular Tags

Current selected tag: 'infographic tools'. Clear
Rescooped by Elizabeth E Charles from Keeping up with Ed Tech
Scoop.it!

A Great List of Tools for Making Cool Infographics | Free Technology for Teachers

A Great List of Tools for Making Cool Infographics | Free Technology for Teachers | Information and digital literacy in education via the digital path | Scoop.it
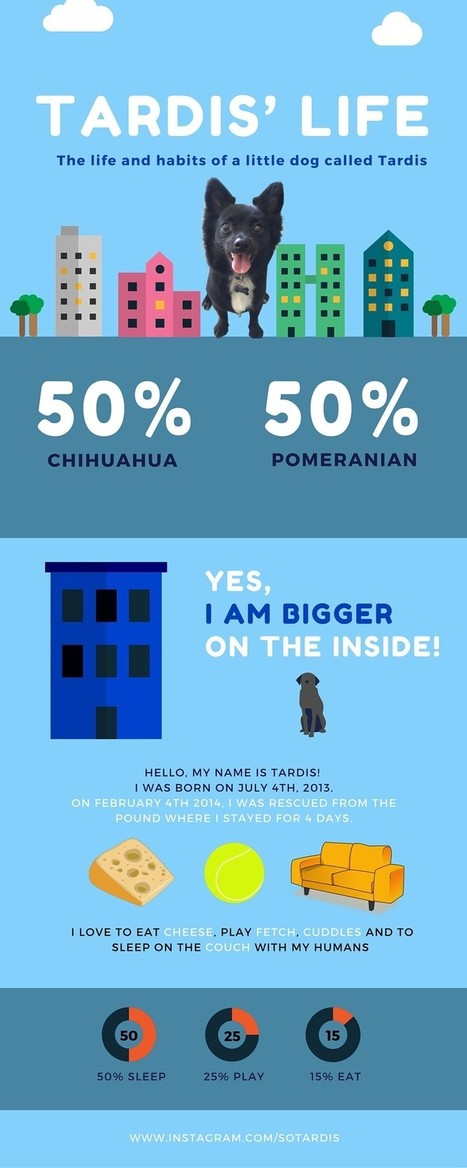
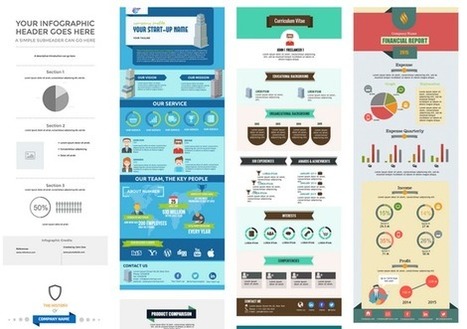
Cool Infographics is a book and a blog written by Randy Krum. I read his book a few years ago and came away with some great desig

Via WebTeachers
No comment yet.
Rescooped by Elizabeth E Charles from Digital Delights for Learners
Scoop.it!

Adioma - Make Infographics With Timelines, Grids and Icons

Adioma - Make Infographics With Timelines, Grids and Icons | Information and digital literacy in education via the digital path | Scoop.it
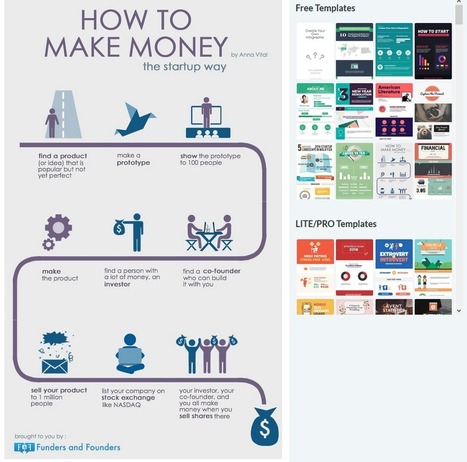
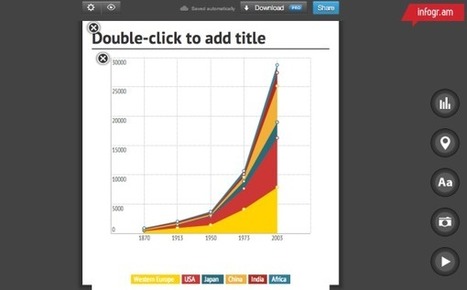
Adioma is an infographic maker that automates design for you using visual language and infographic templates. Sign up and create infographics in minutes.

Via Ana Cristina Pratas
No comment yet.
Scooped by Elizabeth E Charles
Scoop.it!

4 Amazing Infographic Tools for Producing Visual Learning

4 Amazing Infographic Tools for Producing Visual Learning | Information and digital literacy in education via the digital path | Scoop.it
If you want some amazing infographic tools for sharing visual learning projects, look no further than these 4 heavyweight graphical contenders.
No comment yet.
Rescooped by Elizabeth E Charles from EdTech Evolution - Mapping the Intersection of tech, innovation, and instruction
Scoop.it!

9 Fundamental Digital Skills for 21st Century Teachers

9 Fundamental Digital Skills for 21st Century Teachers | Information and digital literacy in education via the digital path | Scoop.it
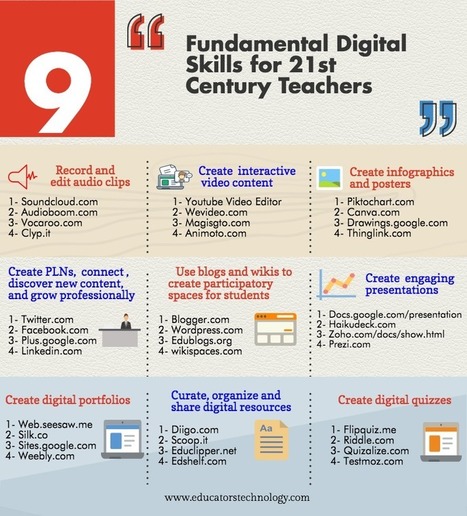
Free resource of educational web tools, 21st century skills, tips and tutorials on how teachers and students integrate technology into education

Via Dean J. Fusto
Rescooped by Elizabeth E Charles from Digital Delights for Learners
Scoop.it!

20+ Tools to Create Your Own Infographics

20+ Tools to Create Your Own Infographics | Information and digital literacy in education via the digital path | Scoop.it
A picture is worth a thousand words – based on this, infographics would carry hundreds of thousands of words, yet if you let a reader choose between a

Via Ana Cristina Pratas
Jeff Domansky's curator insight, June 5, 2016 11:42 PM

Nice updated list of infographics tools.

 
Bart van Maanen's curator insight, June 6, 2016 11:38 AM
Soms kun je een verhaal goed vertellen met een infographic, regelijk een vorm die zich goed laat delen op sociale media. Misschien kun je er ook wel een creatief cv mee maken. Maak je eigen #infographics met een van deze online tools. 
Cristina Maria Cibin's curator insight, February 25, 2017 5:05 PM
Scooped by Elizabeth E Charles
Scoop.it!

7 Tools for Building an Infographic in an Afternoon (Design Skills or Not)

7 Tools for Building an Infographic in an Afternoon (Design Skills or Not) | Information and digital literacy in education via the digital path | Scoop.it
A quick overview of the best (free) infographic makers and how to quickly build a beautiful infographic - design skills or not.
No comment yet.
Rescooped by Elizabeth E Charles from Keeping up with Ed Tech
Scoop.it!

How to Make an Infographic for Free with PowerPoint

How to Make an Infographic for Free with PowerPoint | Information and digital literacy in education via the digital path | Scoop.it
You can make infographics easily and quickly with PowerPoint. PowerPoint is an undercover infographic design tool that requires very little effort to produce beautiful, high quality graphics.

Via WebTeachers
No comment yet.
Rescooped by Elizabeth E Charles from Learning & Technology News
Scoop.it!

Creating engagement through interactive infographics

Creating engagement through interactive infographics | Information and digital literacy in education via the digital path | Scoop.it

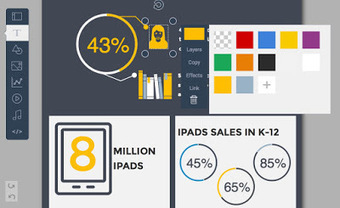
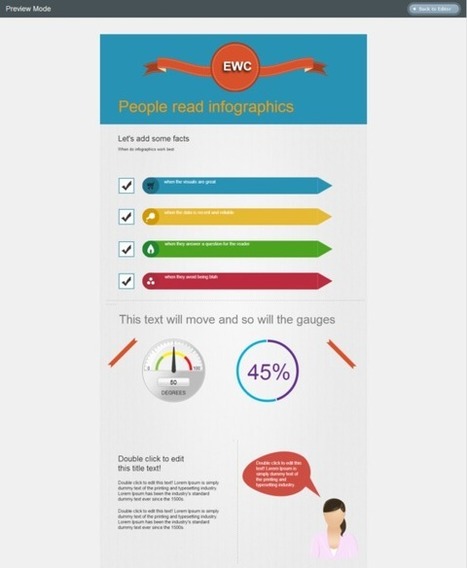
I’ve been a long term advocate of the use of infographics in education and especially enjoy thinking of ways that students can be encouraged to engage with and question the content as well as create their own graphics, so when I rediscovered Visme.co I was really delighted to find the tool that I once thought was a PowerPoint substitute for creating online presentations had turned into an awesome interactive infographic creator.


Via Nik Peachey
Elizabeth E Charles's insight:

My blog post with tips for using infographics to create engaging online materials.

Marcel Plenchette's curator insight, March 22, 2016 2:30 AM

My blog post with tips for using infographics to create engaging online materials.

Wendy Zaruba-Lundene's curator insight, March 23, 2016 9:15 AM

My blog post with tips for using infographics to create engaging online materials.

Joshua Smith's curator insight, May 31, 2021 10:18 PM

Another great example of a different way to implement technology in the classroom

Rescooped by Elizabeth E Charles from Digital Literacy in the Library
Scoop.it!

9 Tools for Making Infographics in the Classroom

9 Tools for Making Infographics in the Classroom | Information and digital literacy in education via the digital path | Scoop.it

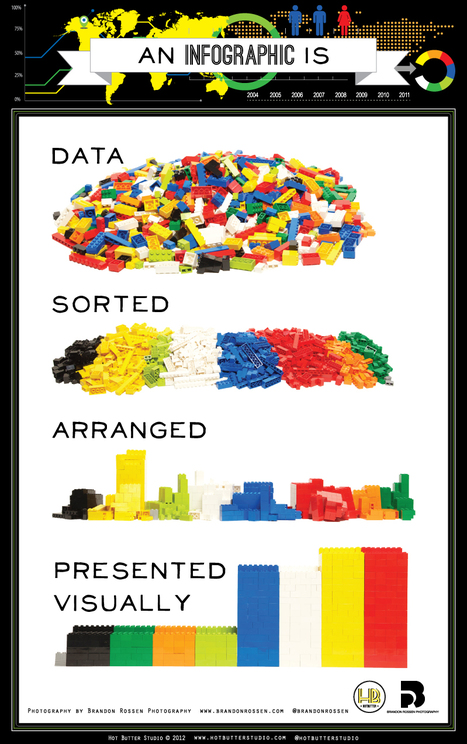
From Global Digital Citizen: "Creating great infographics need not be a chore, no matter if you’re a teacher or a student. Taking information and presenting it in an artful and visually appealing way has never been easier, thanks to Web 2.0 tools.

Before you dive in, here are some quick tips:

Collect your data. If you have been collecting data, compile it all in a spreadsheet.Decide the best way to present your data (flyer-style, bar charts, line charts, Venn diagrams, histogram, scatter plot charts, flow charts, timelines, etc.).Design a rough sketch so you don’t end up flying blind.Pick your app and get to work!"
Via Mary Reilley Clark
Mary Reilley Clark's curator insight, May 22, 2015 12:23 PM

Share with teachers to give a quick overview of the many tools out there to create infographics. Our students have been using Piktochart a lot this year, but it's always good to have a few options available.

Peta White's curator insight, March 19, 2016 3:41 AM

Share with teachers to give a quick overview of the many tools out there to create infographics. Our students have been using Piktochart a lot this year, but it's always good to have a few options available.

Scooped by Elizabeth E Charles
Scoop.it!

Managing Cognitive Load in eLearning Infographic | e-Learning Infographics

Managing Cognitive Load in eLearning Infographic | e-Learning Infographics | Information and digital literacy in education via the digital path | Scoop.it
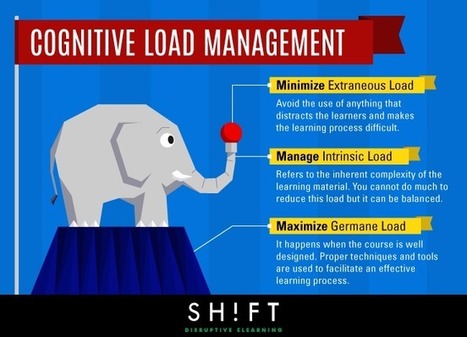
The Managing Cognitive Load in eLearning Infographic provides tips to help you manage cognitive load in your eLearning courses.
No comment yet.
Rescooped by Elizabeth E Charles from Education and Tech Tools
Scoop.it!

17 Fantastic Infographic Generators!

Data is crucial. However, displaying a chunk of plain data can be monotonous. Infographics visualize plain data and make it visually more appealing. Data turned into infographic has a higher potential to go viral and be effective. While many of us are designers who can design amazing infographs, Infographic Generators can come in handy to Designers and non-designers alike. They can be a time saving resource. So here is a list of 17 fantastic Infographic Generators I compiled together:...


Via Jeff Domansky, Becky Roehrs
Willem Kuypers's curator insight, March 9, 2015 2:37 AM

J'utilise de plus en plus les info-graphiques. Ce site aide à les créer pour ceux qui sont moins doués en graphisme.

Fran Bozarth's curator insight, March 11, 2015 2:31 PM

This could spice up just about any presentation - student or instructor. 

Monica S Mcfeeters's curator insight, March 20, 2015 11:49 PM

Here are links for to help with creating info-graphs.

Scooped by Elizabeth E Charles
Scoop.it!

The Best Simple Tools to Create Infographics for Your Class ~ Educational Technology and Mobile Learning

The Best Simple Tools to Create Infographics for Your Class ~ Educational Technology and Mobile Learning | Information and digital literacy in education via the digital path | Scoop.it
No comment yet.
Scooped by Elizabeth E Charles
Scoop.it!

Visme: Bring Visuals to Life

Visme: Bring Visuals to Life | Information and digital literacy in education via the digital path | Scoop.it
Looking for a cool way to add some pizzazz to infographics and presentations? Visme could be the answer. Here`s an in-depth review of this marketing tool.
No comment yet.
Rescooped by Elizabeth E Charles from Keeping up with Ed Tech
Scoop.it!

Visme vs. Piktochart: Which One is Right for You?

Visme vs. Piktochart: Which One is Right for You? | Information and digital literacy in education via the digital path | Scoop.it
A visual comparison of two leading online infographic tools. Covers key differences in template designs, collaboration tools, interactivity and animation

Via WebTeachers
No comment yet.
Scooped by Elizabeth E Charles
Scoop.it!

Presentation Design Guide from Visme

Presentation Design Guide from Visme | Information and digital literacy in education via the digital path | Scoop.it

Visme is a design tool that allows everyone to create beautiful graphics that help tell a story and engage an audience. You can use Visme to create presentations, infographics, graphics, charts, and reports.
No comment yet.
Scooped by Elizabeth E Charles
Scoop.it!

Tools for Creating, Hosting, and Printing Infographics

Tools for Creating, Hosting, and Printing Infographics | Information and digital literacy in education via the digital path | Scoop.it
About a week I was asked if I could write a post about tools for making infographics with students. A well constructed infographic ca
No comment yet.
Scooped by Elizabeth E Charles
Scoop.it!

Piktochart for Digital Literacy

Technology is changing the way our students learn, read, and obtain information. We need to create a curriculum that nurtures this way of learning. Bein
No comment yet.
Scooped by Elizabeth E Charles
Scoop.it!

So you want to make in infographic? 4 useful options

So you want to make in infographic? 4 useful options | Information and digital literacy in education via the digital path | Scoop.it

We're putting together a guide to various infographic software for our
students, so I've had cause to play around with a few. I find a lot of
tools recomended on the web just don't quite work for educational stuff
(or, indeed, library stuff); they're just too much style and not enough
substance.

Also, all the articles about infographic tools are entitled things like '
61 GREAT INFOGRAPHIC PACKAGES!' which always baffles me somewhat. Maybe  it's the information professional in me, but I think if you're going to write something recommending a set of tools, you should at least narrow the number down to a recommended few...


No comment yet.
Scooped by Elizabeth E Charles
Scoop.it!

10 free tools for creating infographics

10 free tools for creating infographics | Information and digital literacy in education via the digital path | Scoop.it
For all the importance we place on text, it's an indisputable fact that images are processed in the brain faster than words. Hence the rise and rise of the infographic which, at its best, transforms complex information into graphics that are both easy to grasp and visually appealing. No wonder magazine readers and web visitors love the best infographics.
No comment yet.
Rescooped by Elizabeth E Charles from Keeping up with Ed Tech
Scoop.it!

Visme: Easily Create Online Presentations, Infographics, and Other Visual Content

Visme: Easily Create Online Presentations, Infographics, and Other Visual Content | Information and digital literacy in education via the digital path | Scoop.it
Here you can find the Round Up's collection of in-depth reviews on the latest programs, apps, websites, and more. Make sure to click the review's title or the Read More link for the complete review!

Via WebTeachers
No comment yet.
Scooped by Elizabeth E Charles
Scoop.it!

How to Create PowerPoint Infographic Elements

How to Create PowerPoint Infographic Elements | Information and digital literacy in education via the digital path | Scoop.it
If you think infographics are only for marketing and data visualization, think again. They’re actually really helpful for anyone building online training because they use a lot of the same elemen...
No comment yet.
Scooped by Elizabeth E Charles
Scoop.it!

Infographics for You to Use: Information Literacy, Copyright, Attribution, and Plagiarism

Infographics for You to Use: Information Literacy, Copyright, Attribution, and Plagiarism | Information and digital literacy in education via the digital path | Scoop.it
Want to use infographics in your space, but don't have the time to create your own from scratch?  Well, thanks to A Media Specialist's Guide to the Internet, we have infographics of all kinds - thi...
No comment yet.
Scooped by Elizabeth E Charles
Scoop.it!

How to Get Infographic Ideas to Spring Forth

How to Get Infographic Ideas to Spring Forth | Information and digital literacy in education via the digital path | Scoop.it
Infographics don’t rock. They roll, and take your brand with them. Learn where to start, how to brainstorm, and how to synthesize ideas. Plus, see an original infographic –25 concepts and themes – that was created to inspire your own.
No comment yet.
Scooped by Elizabeth E Charles
Scoop.it!

The Educators' Guide to Infographics

The Educators' Guide to Infographics | Information and digital literacy in education via the digital path | Scoop.it
Sometimes when you're compiling your content for your next blog post you find that, to get your point across, you have to cover a lot of facts and figures, statistics, or tabular information, and i...
No comment yet.
Scooped by Elizabeth E Charles
Scoop.it!

5 Great Online Tools for Creating Infographics - Blog About Infographics and Data Visualization - Cool Infographics

5 Great Online Tools for Creating Infographics - Blog About Infographics and Data Visualization - Cool Infographics | Information and digital literacy in education via the digital path | Scoop.it

Professional infographic designers rely primarily on a core vector graphics software program to create their infographics designs. The main advantage is that all the icons, charts, images, illustrations, and data visualizations are treated as separate objects that can be easily moved, resized, overlapped, and rotated. No matter where you create the individual design elements, the final infographic design is usually put together in a vector graphics program.

No comment yet.