information analyst
43.8K views | +2 today
Follow
information analyst
km, ged / edms, workflow, collaboratif
Your new post is loading...
Rescooped by michel verstrepen from Thinking about Systems
Scoop.it!

Build maps with Google Sheets

Build maps with Google Sheets | information analyst | Scoop.it
Our new Google Sheets integration allows you to build maps using the data within an online spreadsheet. This is great for crowdsourcing maps, especially when you need to get lots of people up and running quickly and you'd rather not...

Via Steve Wilhite
No comment yet.
Rescooped by michel verstrepen from Digital Presentations in Education
Scoop.it!

CIRCOS - Software for Data Visualization

CIRCOS - Software for Data Visualization | information analyst | Scoop.it

Circos is a software package for visualizing data and information. It visualizes data in a circular layout — this makes Circos ideal for exploring relationships between objects or positions.

Circos is ideal for creating publication-quality infographics and illustrations with a high data-to-ink ratio, richly layered data and pleasant symmetries. You have fine control each element in the figure to tailor its focus points and detail to your audience.


Via Baiba Svenca
No comment yet.
Rescooped by michel verstrepen from visual data
Scoop.it!

5 Amazing Data Visualization Tools

5 Amazing Data Visualization Tools | information analyst | Scoop.it

Want to create your own maps, graphs, charts, and diagrams but don’t have the software to do it? Here are five top-notch applications which will let you create professional quality data visualizations for free.


Via Lauren Moss
No comment yet.
Rescooped by michel verstrepen from Bazaar
Scoop.it!

Guitar Pro 6 tutorial "Notating chords and strumming patterns"

This video shows how to add chords and strumming directions using Guitar Pro 6 software. The song used is Happy Birthday and is an original arrangement.

Via Club de TeleMatique
No comment yet.
Rescooped by michel verstrepen from Teaching & Learning Resources
Scoop.it!

Microsoft's Free Tools

Microsoft's Free Tools.


Via Baiba Svenca, Pilar Pamblanco
No comment yet.
Rescooped by michel verstrepen from visual data
Scoop.it!

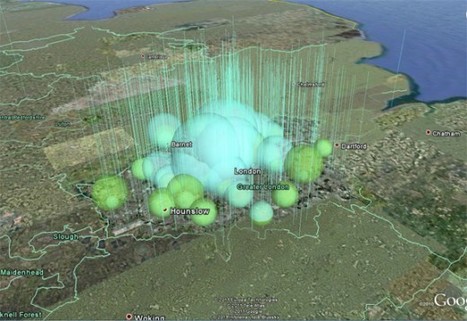
DataAppeal lets you create your own location-based infographics

DataAppeal lets you create your own location-based infographics | information analyst | Scoop.it
It’s often said that we’re in the midst of the information age, which may help explain why there’s been a surge in infographics in recent years – they make data just that little bit more…palatable. But if you’re more of a spreadsheets kind of person than an artist, this application could be what you’re looking for.

DataAppeal is a Web-based, data-design visualization application that allows users to transform their location-based data into infographics through the creation of 3D and animated maps.


Via Lauren Moss
No comment yet.