information analyst
43.8K views | +0 today
Follow
information analyst
km, ged / edms, workflow, collaboratif
Your new post is loading...
Rescooped by michel verstrepen from visual data
Scoop.it!

Data Visualization and Infographics Resources

Data Visualization and Infographics Resources | information analyst | Scoop.it
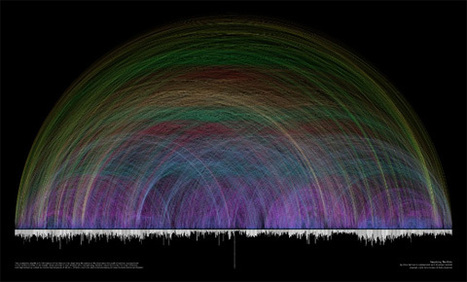
Data visualizations and infographics can make complex datasets easier to understand and comprehend. By creating a graphical represenatation of data and statistics, complicated concepts and information can make more sense in less time.

Many visualizations focus on representing a specific set of data or statistical information. Others focus on less-concrete topics, providing a visual representation of abstract concepts. Generally speaking, the first type appear more like graphs or charts and the latter are often more creative and imaginative.
But visualizations and infographics can be used poorly, too. Putting in too much information (or not enough), using improper formats for the information provided, and other failures are common. Visit the article link for more than 25 useful resources for infographics and data visualization. Most are galleries of effective graphics though some also provide how-to information for information designers...


Via Lauren Moss
No comment yet.
Rescooped by michel verstrepen from visual data
Scoop.it!

Power of Data Visualization - An infographic inspiration site

Power of Data Visualization - An infographic inspiration site | information analyst | Scoop.it
Power of Data Visualization - An infographic inspiration site.

Information graphics or infographics are graphic visual representations of information, data or knowledge. These graphics present complex information quickly and clearly, such as in signs, maps, journalism, technical writing, and education. With an information graphic, computer scientists, mathematicians, and statisticians develop and communicate concepts using a single symbol to process information.


Via Lauren Moss
No comment yet.
Rescooped by michel verstrepen from The Social Media Learning Lab
Scoop.it!

Transliteracy : Constructing Knowledge and Networks, New trends, tech, terms

Transliteracy : Constructing Knowledge and Networks, New trends, tech, terms | information analyst | Scoop.it

"This hot whiteboard illustration of the nuances of social media is going the distance.  After sharing it on Facebook & Pinterest, it now appears here in a new context, Transliteracy."


Librarians gathered together for a one-day conference on ARLD Day 2012 (27 April) in Minnesota to engage, discuss and connect on the theme “Transliteracy: Constructing Knowledge and Networks and more.


____________________________


“Transliteracy is the ability to communicate meaning between media. ...Transliteracy helps us promote literacy across technological barriers.”  

____________________________


Lane Wilkinson, Assistant Professor and reference and instruction librarian at the University of Tennessee at Chattanooga, advocated a new literacy taxonomy in his keynote presentation. Lane shared his views on "What is Transliteracy?


See the full presentation with slides & audio, via the original article link here.


Via Sue Thomas, Deb Nystrom, REVELN
Deb Nystrom, REVELN's comment, July 24, 2012 3:08 PM
I shared this on Facebook & Pinterest, but it also belongs elsewhere too, obviously. Thanks for the inclusion.