information analyst
43.8K views | +2 today
Follow
information analyst
km, ged / edms, workflow, collaboratif
Your new post is loading...
Rescooped by michel verstrepen from eLearning Innovations
Scoop.it!

Vintage Data Visualization: 35 examples from before the Digital Era

Vintage Data Visualization: 35 examples from before the Digital Era | information analyst | Scoop.it

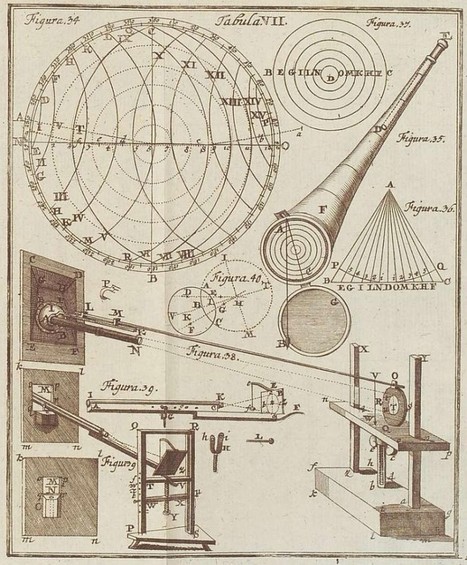
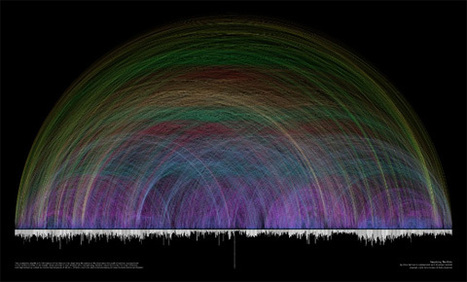
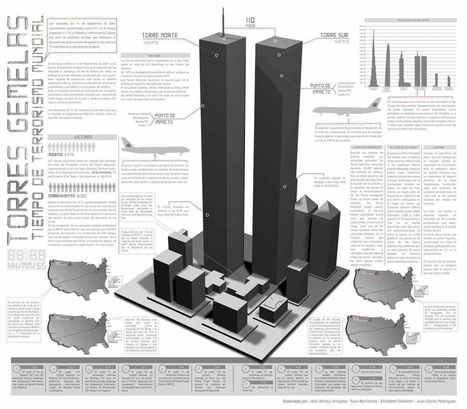
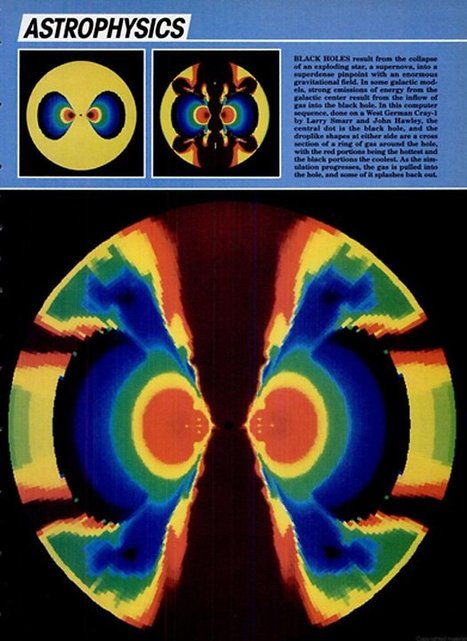
Graphics, charts, diagrams and visual data representations have been published on books, newspapers and magazines since they've existed, not to mention old maps and scientific illustrations...


Despite the lack of tools such as the ones we have at our disposal nowadays, they are as inspiring and important as the best contemporary visualizations. Visit the article link for a gallery of vintage visualizations...


Via Lauren Moss, Bucky Dodd
Mariana Soffer's comment, July 20, 2013 9:39 AM
my pleasure
Charlley Luz's curator insight, July 20, 2013 10:26 AM

muito legal, os Infográficos antes de existir a internet. 35 exemplos de infográficos no papel :) Achei falta do Marcha para Moscou do Minard http://www.datavis.ca/gallery/re-minard.php ;

Leoncio Lopez-Ocon's curator insight, July 20, 2013 2:57 PM

El brasileño Tiago Veloso, fundador de Visual Loop, nos ofrece 35 interesantísimas representaciones visuales de distintos fenómenos y eventos que permiten hacer un paseo por la historia de la ilustración científica.

Rescooped by michel verstrepen from visual data
Scoop.it!

Data Visualization and Infographics Resources

Data Visualization and Infographics Resources | information analyst | Scoop.it
Data visualizations and infographics can make complex datasets easier to understand and comprehend. By creating a graphical represenatation of data and statistics, complicated concepts and information can make more sense in less time.

Many visualizations focus on representing a specific set of data or statistical information. Others focus on less-concrete topics, providing a visual representation of abstract concepts. Generally speaking, the first type appear more like graphs or charts and the latter are often more creative and imaginative.
But visualizations and infographics can be used poorly, too. Putting in too much information (or not enough), using improper formats for the information provided, and other failures are common. Visit the article link for more than 25 useful resources for infographics and data visualization. Most are galleries of effective graphics though some also provide how-to information for information designers...


Via Lauren Moss
No comment yet.
Rescooped by michel verstrepen from visual data
Scoop.it!

Power of Data Visualization - An infographic inspiration site

Power of Data Visualization - An infographic inspiration site | information analyst | Scoop.it
Power of Data Visualization - An infographic inspiration site.

Information graphics or infographics are graphic visual representations of information, data or knowledge. These graphics present complex information quickly and clearly, such as in signs, maps, journalism, technical writing, and education. With an information graphic, computer scientists, mathematicians, and statisticians develop and communicate concepts using a single symbol to process information.


Via Lauren Moss
No comment yet.
Rescooped by michel verstrepen from Graphic Coaching
Scoop.it!

Latest Creative Infographic Trends: a visualization gallery

Latest Creative Infographic Trends: a visualization gallery | information analyst | Scoop.it

Infographics have become very famous the past years, and there have been have been numerous examples and posts showcasing inspiring and creative infographics related to certain topics across the internet.


This particular collection of designs includes 10 infographics that are not all focused on a specific niche subject, though they can all serve as examples of creative visualizations and innovative ways to convey information. Hopefully they will help inform or provide inspiration for any potential new and developing data visualization projects you may be working on...


Via Lauren Moss, Dave Wood
No comment yet.
Rescooped by michel verstrepen from visual data
Scoop.it!

10 of the Best Sources for Infographic Inspiration

10 of the Best Sources for Infographic Inspiration | information analyst | Scoop.it
Information graphics or “infographics” are graphic visual representations of information, data, or knowledge.

Infographics help us absorb facts and figures in the most effective way possible. They come in extremely handy when you need to explain complex information, numbers or data rather quickly and effectively. One cool way to get inspired is to look at some of the best infographics out there.

Infographics are an excellent way to add humor or irreverence to tell a great story in short possible way. However, infographics can be pretty hard to design since you have to gather together a lot of information and make it look good. Today we're to sharing the top places to see some great visual graphics and also find inspiration to create your own...


Via Lauren Moss
No comment yet.
Rescooped by michel verstrepen from visual data
Scoop.it!

Archive Gallery: The Power of Data

Archive Gallery: The Power of Data | information analyst | Scoop.it
Supercomputers, search functions and the scattering of personal data to the four winds (Computer Visualization of a Black Hole Emission Supercomputers, search functions and the scattering of personal...)...

Now that we've spent time looking at all the incredible ways data is gathered, computed, analyzed and used, we thought we'd take a look through the archives to see how we got to this data age to begin with.


Via Lauren Moss
No comment yet.