


Google Drawing https://docs.google.com/drawings Google drawing is probably one of the less well known apps within the
Get Started for FREE
Sign up with Facebook Sign up with X
I don't have a Facebook or a X account


 Your new post is loading...
 Your new post is loading...
Your new post is loading...
Google Drawing https://docs.google.com/drawings Google drawing is probably one of the less well known apps within the 
No comment yet.
Sign up to comment
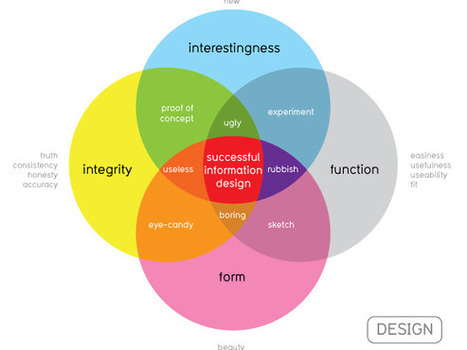
Information graphics or infographics are graphic visual representations of information, data or knowledge. These graphics present complex information quickly and clearly, and are easy to understand. Infographics are sources of interesting information, when you are in need of some. Reading boring, long, colorless articles isn’t so attractive and interesting than reading and viewing facts and numbers in an illustrated way. Not only an illustrated way, but a very creative, attractive and super-appealing way. All of them have been designed not only to look good, but also to expose the maximum information and data possible. These infographics were made by some very talented designers, with creative minds and superb skills. While there are lots of really interesting and cool infographics on various topics, in this post we have only gathered awesome infographics which are of interest to web designers and developers... Via Lauren Moss
Robin Good: If you consider, like I do, "infographics" as visual presentation tools, I strongly suggest you to browse through this excellent slideshow by Robin Richards, which provides an overview of why infographics are important, gives a glimpse of their history, application and creation and gives a good insight on what makes them truly effective.
Recommended. 9/10
Original presentation: http://www.slideshare.net/ripetungi/why-are-infographics-important
Via XPLAIN, Robin Good
|
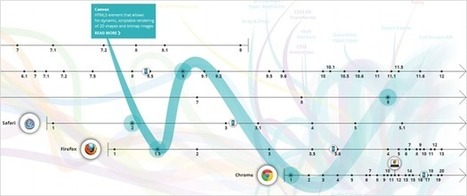
Interactive data visualizations are an exciting way to engage and inform large audiences. They enable users to focus on interesting parts and details, to customize the content and even the graphical form, and to explore large amounts of data. At their best, they facilitate a playful experience that is way more engaging than static infographics or videos. Several ideas and concepts of interaction design for data visualizations are presented in this post, using 11 examples from the web. The overall concepts featured include: The Basics: Highlighting and Details on Demand Making More Data Accessible: User-driven Content Selection Showing Data in Different Ways: Multiple Coordinated Visualizations Showing Data in Different Ways: User-driven Visual Mapping Changes Integrating Users’ Viewpoints and OpinionsVisit the complete article for numerous links, useful visuals and specific details on how to understand, implement and evaluate interactive design elements used in data visualization design. Via Lauren Moss

Hans's comment,
October 2, 2012 5:09 AM
Great article, I really like the idea of interactive information with details on demand. As an interaction designer I always try to balance content management and usability. Here are some interesting examples that made me consider a complete information surface vs a deep level on demand architecture.
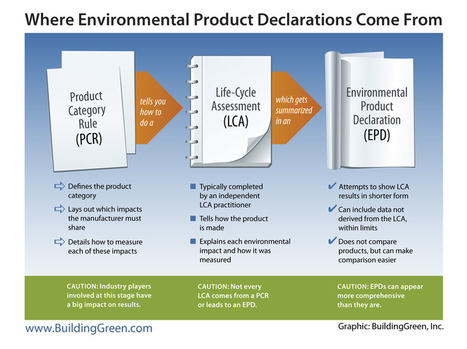
Visually-compelling content can take many forms, from creatively produced videos to engaging Facebook photos. Today, we thought we would give a quick course in one of the the highest forms of visually powerful content: Infographics. Mashable defines infographics as graphic visual representations of information, data or knowledge used to present complex information quickly and clearly. Infographics are becoming more common in the building industry, particularly on websites and blogs catering to architects and designers. The best infographics try to articulate one of five key communications challenges. Read the complete article for an example of each of these challenges in action on popular industry websites... Via Lauren Moss
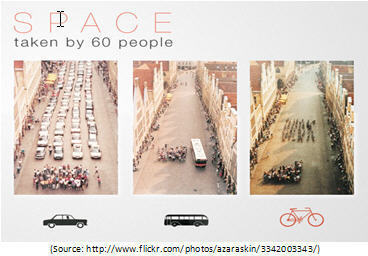
The demand for public data has been accompanied by a desire to present it in more visually appealing and easy to understand ways... Via Lauren Moss
|


