


 Your new post is loading...


This seems like a straightforward question, but it’s proven to be a difficult one to answer. Even visualization researchers – people who think about the subject all day and every day – don’t have a clear definition of what visualization is. Is it synonymous with information graphics? Does visualization have to be computer generated? Does data have to be involved, or can it be abstract? The answers vary depending on who you ask.
To me, visualization is a medium. It’s not just an analysis tool nor just a way to prove a point more clearly through data.
Visualization is like books. There are different writing styles and categories, there are textbooks and there are novels, and they communicate ideas in different ways for varied purposes. And just like authors who use words to communicate, there are rules that you should always follow and others that are guidelines that you can bend and break...
Via Lauren Moss


"Visualization is like books. There are different writing styles and categories, there are textbooks and there are novels, and they communicate ideas in different ways for varied purposes. "
De très nombreux exemples d'infographies, malheureusement pas toujours aboutis. A croiser avec d'autres infographies ou représentations sur des sujets identiques ou bien à rapprocher des données sources.
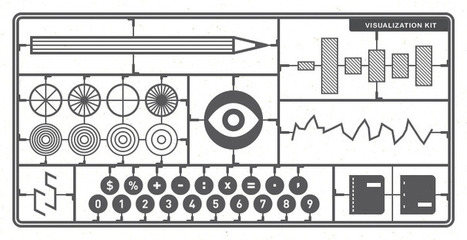
Visualization