Design, Science and Technology
45.7K views | +3 today
Follow
Design, Science and Technology
#ideas #design #science #technology #inspiration #media #information
Your new post is loading...
Rescooped by Antonios Bouris from innovative design
Scoop.it!

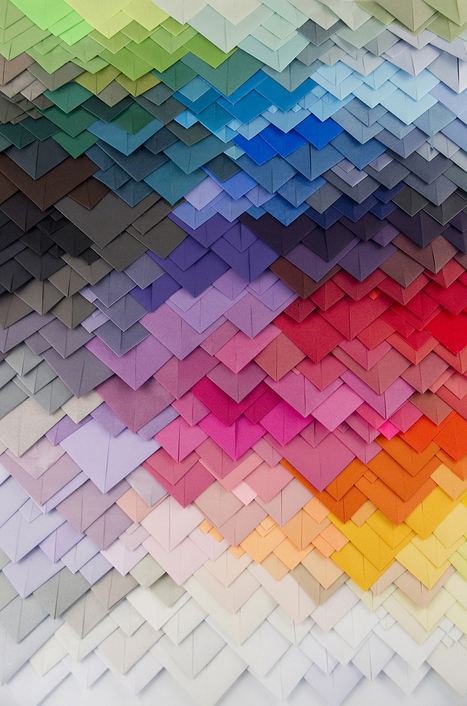
Transfixing 3D Paper Patterns by Maud Vantours

Transfixing 3D Paper Patterns by Maud Vantours | Design, Science and Technology | Scoop.it

Paris-based designer and artist Maud Vantours uses layer upon layer of cut paper to create hypnotizing patterns and textures that translate into set designs, fashion accessories, and editorial treatments. Vantors has explored a number of 3D paper treatments including floral patterns, spirals and geometric designs.


Via Lauren Moss
Nexo Marketing's curator insight, April 23, 2014 7:50 AM

Show!!

copeaudelune's curator insight, April 25, 2014 10:52 AM

Un peu de couleur dans ce monde de 'brut'

Rescooped by Antonios Bouris from visualizing social media
Scoop.it!

The Many Faces of Influence [infographic]

The Many Faces of Influence [infographic] | Design, Science and Technology | Scoop.it

Inspired by the rich variety of influencer types our customers discover, we looked for patterns and identified 10 key archetypes. Among these influencer profiles are:

the Authority, the influencer who is expert in connecting topic areas and can package insights into a meaningful bundle for his audience;the Insider, who finds alliances to build the market story he needs to tell and pushes the industry forward; andthe Agitator, who always looks for ways to stir the pot and push conversations to new heights. 

Filled with fun facts and tips about what motivates the different types of online influencers,The Many Faces of Influence infographic is a simple guide to understanding how to be a part of their community and knowing the best ways to engage them.

Explore this inforgraphic to learn more about The Many Faces of Influence...


Via Lauren Moss
No comment yet.
Rescooped by Antonios Bouris from visual data
Scoop.it!

Mapping the 'Time Boundaries' of a City

Mapping the 'Time Boundaries' of a City | Design, Science and Technology | Scoop.it
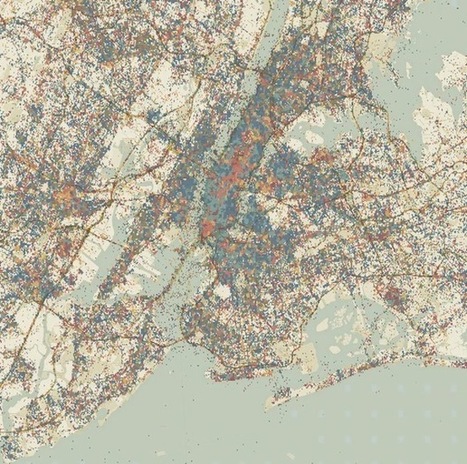
An EU-funded project is building platforms to detect patterns in how people use urban spaces.


Maps don't typically convey time very well. They're static snapshots of a moment in history. A handful of animated maps that do a good job combining time and space using either transit data or geo-tagged social-media hits.

Now a new project, called Geographies of Time, is trying to do something similar with a more typical two-dimensional map. The effort is part of a broader EU-funded projects called UrbanSensing that's building platforms to detect patterns in how people use urban spaces.


Via Lauren Moss
luiy's curator insight, November 28, 2013 6:21 AM

Giorgia Lupi, the Ph.D. researcher at Milan Politecnico behind the project, began with Milan. Using tens of thousands of geo-tagged tweets, she and colleagues divided the map of the city into a fine-grained grid. The tweets were then divided into eight three-hour time intervals (from midnight to 3 a.m., 3 a.m. to 6 a.m., etc.). And the boxes in the grid were digitally colored based on the time window when Twitter was locally most active.

nuria font-casaseca's curator insight, April 24, 2014 9:21 AM

Les ciutats i els temps: com ens movem per la ciutat en funció de l'hora i el dia.