

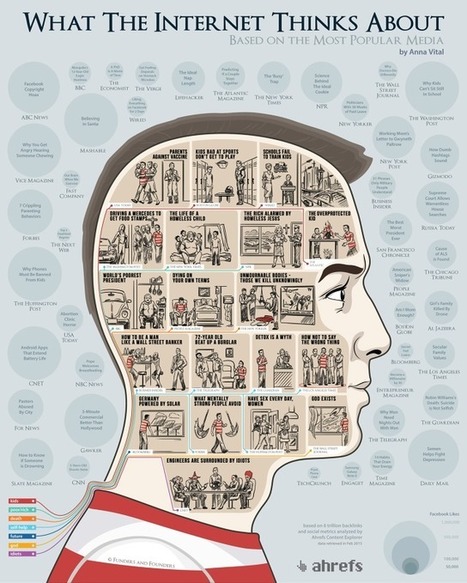
What does the Internet care about? What articles do we share the most? Using the data from the Ahrefs Content Explorer, the people at Funders and Founders
Via Lauren Moss
Get Started for FREE
Sign up with Facebook Sign up with X
I don't have a Facebook or a X account


 Your new post is loading... Your new post is loading...
What does the Internet care about? What articles do we share the most? Using the data from the Ahrefs Content Explorer, the people at Funders and Founders Via Lauren Moss 
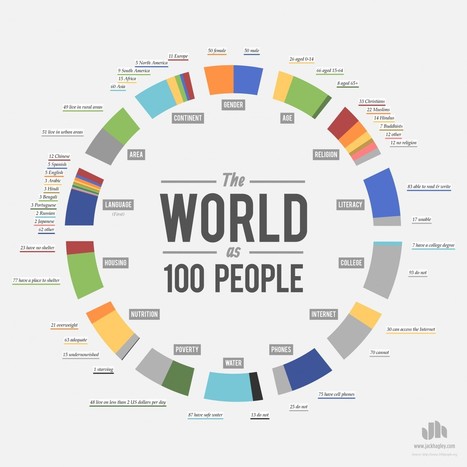
The World as 100 People. This idea has been around since 1990. This is my attempt at presenting the information. Via Beth Dichter

Ryan Rejaei's curator insight,
October 20, 2014 8:41 PM
So interesting. And easy to understand the information 
Becky Roehrs's curator insight,
October 23, 2014 3:54 PM
If you want to see a detailed breakdown and find out where the data came from, here you go: http://www.100people.org/statistics_detailed_statistics.php
"In order for our learners to see how designing information changes how it is viewed, the students this year placed their visual infographics side-by-side with their linear notes to see the transformation. It was the “ah ha” moment, when they could examine how the delivery of content mattered and how the deliberate choices in font hierarchy, color selection, and placement changed the way others perceived the ideas." Via Beth Dichter

Paul Macmullen's curator insight,
October 21, 2014 6:32 PM
Useful reference for a graphically challenges creature of language such as myself :-)

Ness Crouch's curator insight,
July 2, 2015 10:20 PM
Visual and linear learning design should come together to create a learning tool. Infographics are an example of this.
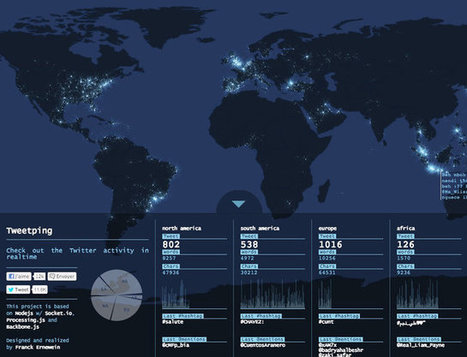
By Franck Ernewein, Tweetping is a map that shows where everyone in the whole world is tweeting from in real time. Much like Poptip’s treatment of Twitter, you’re not really meant to follow it all. Country-by-country tickers do track the total tweets, words, and characters sent since you signed on, but hashtags and @-mentions flash for milliseconds, constantly replaced by a stream of data that can’t be paused for a moment, lest the system fall perpetually behind. Meanwhile, the geolocations of each tweet make their way to a world map as a glowing dot. As the tweets pile up, so do the dots, meaning the world transforms from prehistoric shadows to blindingly bright connectivity in a matter of minutes. Via Lauren Moss
|
![15 Ways to Beat Procrastination [Infographic] | Design, Science and Technology | Scoop.it](https://img.scoop.it/V_0yRgNYaZ3673C8kZ5SRjl72eJkfbmt4t8yenImKBVvK0kTmF0xjctABnaLJIm9)
"Procrastination is definitely not our friend. It makes us randomly search the web, watch funny youtube videos or constantly check twitter stream instead of doing things that matter. It kills our time and leads to failure. Now it's time to beat it! Here are 15 efficient techniques to get rid of procrastination and be more productive!" Via Beth Dichter

Beth Dichter's curator insight,
February 10, 2015 9:21 PM
Do you procrastinate? Do some of your students procrastinate? If so, this infographic may be one you want to share. It provides 15 techniques to help you beat procrastination. Two of the techniques are listed below. Each technique includes a short description plus a how and a why. To view the other 13 click through to the post. * Know Yourself How - Understand how procrastination affects your life Think about the habits that often cause it Why - Insight prevents you from feeling inadequate Helps you understand the causes of procrastination * Commit to assignments How - List tasks that you're confident you will complete Make a point of crossing each task off Why - Rebuilds faith in your own abilities Commits to making good on promises This post is geared to students in high school and college, yet you will find that many of the techniques could be shared with students in elementary and middle school.

Ante Lauc's curator insight,
October 18, 2014 1:48 AM
With better insight who we are, what is our mission, the outcome will be much better. 
Gianfranco Marini's curator insight,
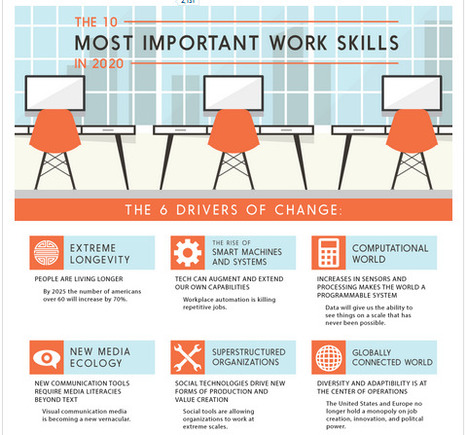
October 18, 2014 3:30 AM
le 10 più importanti competenze e abilità per chi entrerà nel mondo del lavoro intorno al 2020.
L'infografica indica i principali trend e le principali competenze necessarie per lavorare nel futuro prossimo: design mindset transdisciplinarietà cognitive management collaborazione virtuale competenze cross culturali pensiero computazionale competenze nei new media intelligenza sociale
![Bytes Sized: Information Storage, Visualized [infographic] | Design, Science and Technology | Scoop.it](https://img.scoop.it/6SHxhn215FCrc0rwyp7qzTl72eJkfbmt4t8yenImKBVvK0kTmF0xjctABnaLJIm9)
From
visual

We are living in the information age. The amount of information stored, transfered, and processed is growing at a staggering rate. From the common megabyte to the mind-boggling yottabyte, this infographic serves as a guide to understanding the world of bytes! Via Lauren Moss
|


Interesting insight into the internet
At least, the concern about equality, energy and social welfare is there. I like the last one about engineers tho. Hahaha.
I think this article is awesome because they use data visualization to show what people share the most, visit the most, and search the most. Data is everywhere and people are using it everyday and sometimes don't even think about it.