


 Your new post is loading...


An EU-funded project is building platforms to detect patterns in how people use urban spaces.
Maps don't typically convey time very well. They're static snapshots of a moment in history. A handful of animated maps that do a good job combining time and space using either transit data or geo-tagged social-media hits.
Now a new project, called Geographies of Time, is trying to do something similar with a more typical two-dimensional map. The effort is part of a broader EU-funded projects called UrbanSensing that's building platforms to detect patterns in how people use urban spaces.
Via Lauren Moss


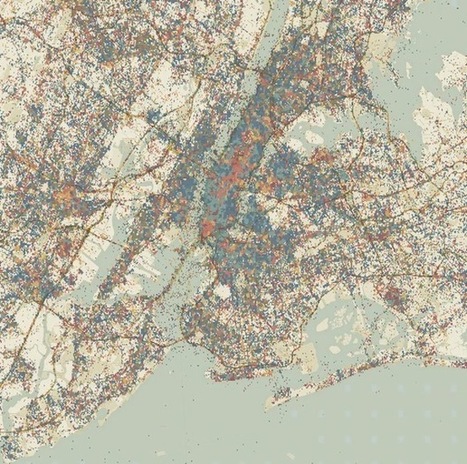
Giorgia Lupi, the Ph.D. researcher at Milan Politecnico behind the project, began with Milan. Using tens of thousands of geo-tagged tweets, she and colleagues divided the map of the city into a fine-grained grid. The tweets were then divided into eight three-hour time intervals (from midnight to 3 a.m., 3 a.m. to 6 a.m., etc.). And the boxes in the grid were digitally colored based on the time window when Twitter was locally most active.
Les ciutats i els temps: com ens movem per la ciutat en funció de l'hora i el dia.