El rincón de mferna
110.4K views | +0 today
Follow
El rincón de mferna
Curando la curiosidad incurable... Matando fiebre ;)
Your new post is loading...
Scooped by Mariano Fernandez S.
Scoop.it!

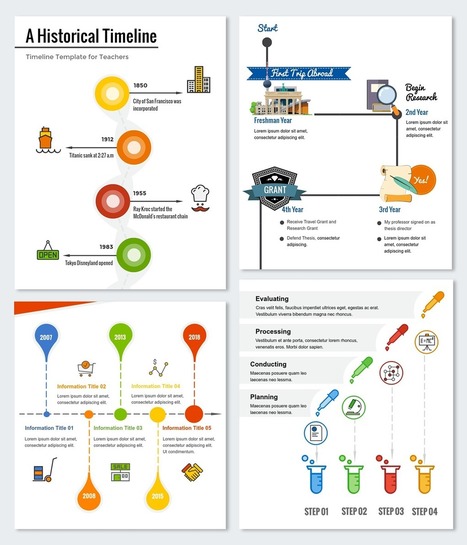
How Students Can Use Timeline Infographics in the Classroom

How Students Can Use Timeline Infographics in the Classroom | El rincón de mferna | Scoop.it

As a foreign language teacher, I am always looking for innovative ways to allow my students to demonstrate what they have learned.

I want students to be able to choose a tool that brings out their creative side and, as a result, leads to a more authentic and meaningful learning experience.

Because learning a language can be difficult, I try to design a variety of activities and projects that will provide students with practice and unique opportunities to develop their language skills through the creation of their projects.


Simon J Condon's curator insight, December 2, 2016 2:54 PM
Students can use to show historical developmentioned in subjects
Yashy Tohsaku's curator insight, December 2, 2016 6:17 PM
Share your insight
Jovi Buendia's curator insight, April 22, 2017 11:09 AM
Visual and much more engaging for ELs.
Rescooped by Mariano Fernandez S. from Moodle and Web 2.0
Scoop.it!

8 steps to designing the perfect infographic | Infographic | Creative Bloq

8 steps to designing the perfect infographic | Infographic | Creative Bloq | El rincón de mferna | Scoop.it
Click the image to see the full size infographic

Via Luísa Lima, Juergen Wagner
No comment yet.
Rescooped by Mariano Fernandez S. from Content Curation World
Scoop.it!

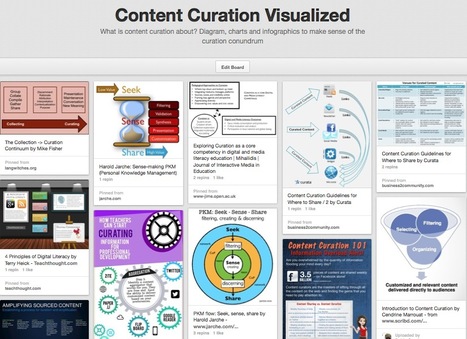
Need To Explain To Others What Content Curation Is? Use This Visual Collection

Need To Explain To Others What Content Curation Is? Use This Visual Collection | El rincón de mferna | Scoop.it
What is content curation about? Diagram, charts and infographics to make sense of the curation conundrum

Via Robin Good
Ali Anani's curator insight, March 4, 2014 12:39 AM

Curate using this visual map

Monica S Mcfeeters's curator insight, March 30, 2014 9:18 AM

This will be helpful to share to those wondering about content curation.

Jeff Domansky's curator insight, September 1, 2014 11:53 PM

Valuable collection of the art of curation from Robin Good.

Rescooped by Mariano Fernandez S. from Web 2.0 for juandoming
Scoop.it!

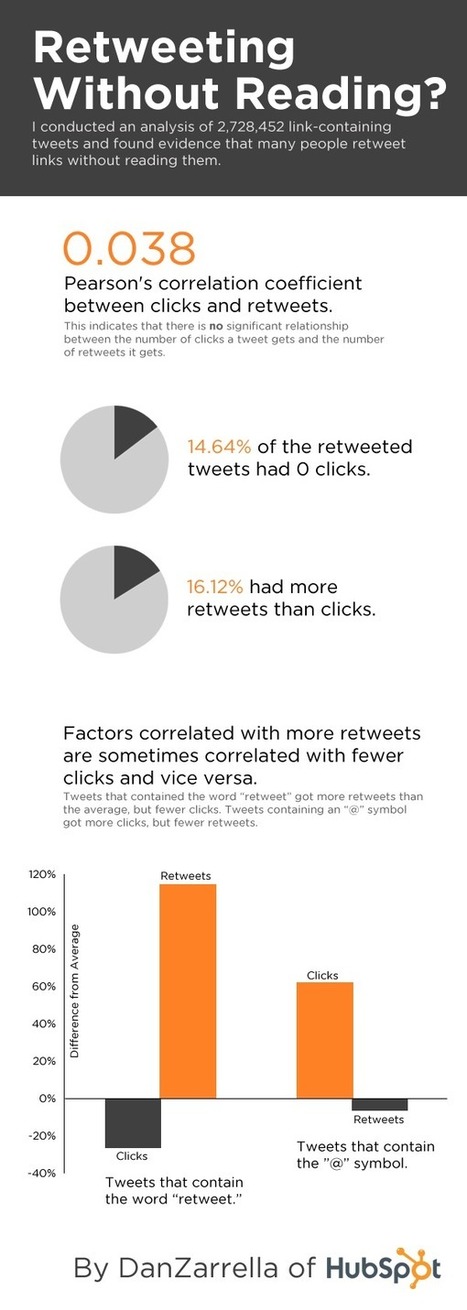
Study Reveals that Twitter users often Retweet without reading or clicking links

Study Reveals that Twitter users often Retweet without reading or clicking links | El rincón de mferna | Scoop.it
If you’ve been on Twitter long enough and use the social platform to share content from your blog or website, and have built a certain level of authority and expertise, after a while you’ll begin to notice automated sharing and retweets of your stuff, often from the same sources. This can be great for traffic and awareness, but it’s a pretty hollow stamp of approval, as your content has obviously been passed on blind.

Via Gust MEES, Paulo Tomás Neves, Francisco Velasquez, juandoming
Steve Tuffill's comment, November 12, 2012 5:51 PM
And if the poster uses the command, "Retweet" rather than "RT", the retweet rate increases twelve-fold...! Remember, less than 100 chars means +17% engagement, too. More than 2 +hashtags reduces this again by 17%!
Rescooped by Mariano Fernandez S. from Moodle and Web 2.0
Scoop.it!

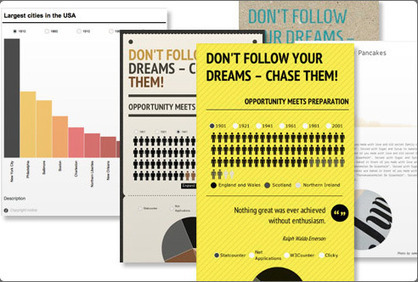
How to Create an Infographic in Under an Hour [+10 Free Templates]

How to Create an Infographic in Under an Hour [+10 Free Templates] | El rincón de mferna | Scoop.it

Wouldn't it be great if creating infographics was just as simple as writing regular ole text-based blog posts? Unfortunately, the reality is that making visual content like this usually takes a lot more time, effort, and let's face it -- skill -- than the written word. 


Usually.But considering the popularity and effectiveness of visual content in marketing today, you can't just afford to throw in the towel. That's why we decided to take all the pain and suffering out of infographic creation. 


Seriously -- don't throw in the towel just yet. You, too, can create professional-looking, high-quality infographics ... quickly! And I'm going to prove it. First things first ...


Via Jeff Domansky, Rui Guimarães Lima, Juergen Wagner
Carmen Ramos's curator insight, April 12, 2015 12:36 PM

Infographiken erstellen einfach gemacht, mit Power Point

Lori Wilk's curator insight, April 14, 2015 10:04 AM

It's great to have tools to make your more #effective and #efficient that allows you to improve your #productivity. Execellent to help us to learn about creating #infographics


Mery Elvis Mt's curator insight, October 7, 2015 8:34 PM

Crear infografías genera un alto engagement, aprende como hacerlas en menos de 1 hora

Rescooped by Mariano Fernandez S. from Transmedia: Storytelling for the Digital Age
Scoop.it!

SEVEN STEPS TO THE PERFECT STORY [Fun Infographic]

SEVEN STEPS TO THE PERFECT STORY [Fun Infographic] | El rincón de mferna | Scoop.it

Via The Digital Rocking Chair
Mary Westcott's curator insight, March 1, 2016 10:14 AM

Maybe a tad too complex for our young students, but still a nice way of understanding the foundations of storytelling!!

Marisa d's curator insight, March 11, 2016 12:22 AM

Maybe a tad too complex for our young students, but still a nice way of understanding the foundations of storytelling!!

Salena Argar's curator insight, May 17, 2017 6:31 AM
Seven steps to the perfect story is a great visual representation of how to build a story. This clearly explains the process of how students can construct their narrative and the types of characters they will use. I would definitely use this in my classroom to help students understand the process of creating a narrative.
Rescooped by Mariano Fernandez S. from eLearning Innovations
Scoop.it!

The Learning Cycle of A 21st Century Student [Infographic]

The Learning Cycle of A 21st Century Student [Infographic] | El rincón de mferna | Scoop.it

Via Gust MEES, Bucky Dodd
Christine Heine's comment, January 8, 2013 6:33 AM
Yes, I liked the feedback from the survey. Just wondering about the sampling. Nonetheless, this isn't how I remember studying.
PDDM's comment January 8, 2013 5:19 PM
1% vinyl? Man we're old...
Marco Bertolini's curator insight, January 20, 2013 2:22 AM
Comment les étudiants étudient-ils ? - 93 % utilisent des applications numériques pour étudier - 70 % étudient seuls - 59 % utilisent leur smartphone - 42 % étudient dans leur endroit favori : leur chambre - 30 % utilisent Google Drive Je suppose qu'il s'agit d'étudiants américains. Et vous ? Quelles méthodes utilisez-vous ?
Rescooped by Mariano Fernandez S. from Herramientas web 2.0
Scoop.it!

"Creación de inforgrafías fácil y online: Infogr.am"

"Creación de inforgrafías fácil y online: Infogr.am" | El rincón de mferna | Scoop.it

1. Selecciona un diseño

2. Añade los datos

3. Comparte o incrusta tu propia infografía!


Via Baiba Svenca, EduClick_España, villaves56
No comment yet.