


 Your new post is loading...

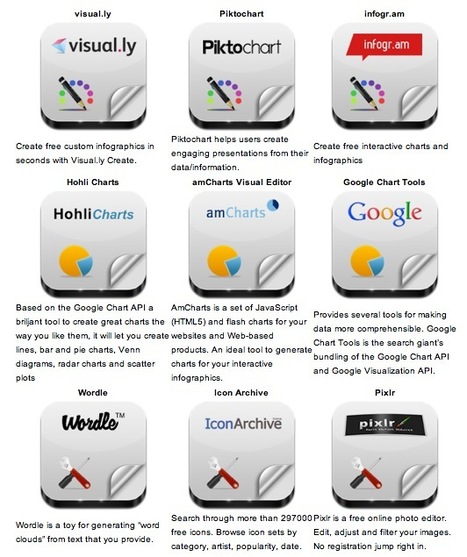

Robin Good: Here is a handy short guide to nine free infographic creation tools that can be utilized to create enticing visuals, word charts and data-based infographics without having special technical skills.
Useful. 8/10
Check them all out: http://www.infographicsarchive.com/create-infographics-and-data-visualization/ ;
(Unearted by @andres taborga)
Via Robin Good, Norman René Trujillo Zapata


![The Learning Cycle of A 21st Century Student [Infographic] | Educación, TIC y ecología | Scoop.it](https://img.scoop.it/QtitpLJrrjpw-L1ePRwuJjl72eJkfbmt4t8yenImKBVvK0kTmF0xjctABnaLJIm9)


Good tools to make Infographics
Infographics voor zij die er nog steeds zot van zijn.
Infographics are great tools to present curated and focused content from a specific perspective.