

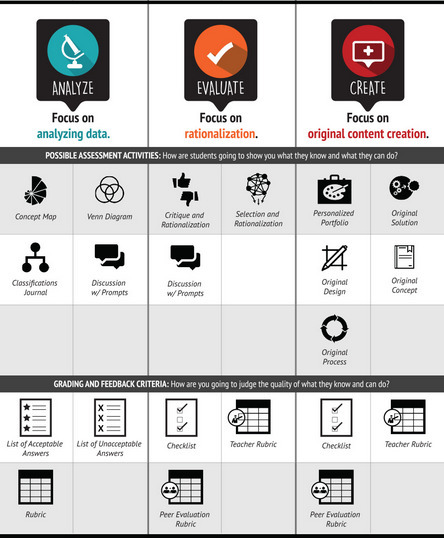

Are you planning and communicating your feedback criteria? Here is our Blended and Online Assessment Taxonomy Design, an infographic to help you plan better assessments.
Get Started for FREE
Sign up with Facebook Sign up with X
I don't have a Facebook or a X account


 Your new post is loading...
 Your new post is loading...
Your new post is loading...
Are you planning and communicating your feedback criteria? Here is our Blended and Online Assessment Taxonomy Design, an infographic to help you plan better assessments.
Beth Dichter's insight:
What two components are necessary for good assessments? This post states: 1. Activity or Performance 2. Feedback Criteria Using Bloom's Revised Taxonomy the infographic looks at each level of Bloom's and provides a short explanation of the focus as well as possible assessment activities AND grading and feedback criteria. 
Given we’ll shortly be reaching the centenary of the outbreak of World War One, we compiled this piece to explain the key global events of the...
Beth Dichter's insight:
If you teach history/social studies this post is right up your alley. The website MadeFromHistory has put together 30 infographics that look at 30 key events in the last 100 years, and they do acknowledge that the have "left out quite a few events" due to space limitations. You can also find sections that focus on World War I, World War II, and Civil Rights as well as a Referenced Blog, which shares a wide variety of topics. For many students, using visuals helps them to recall information more readily. If you teach history from the past 100 years it is worth checking out this website.

David Baker's curator insight,
July 29, 2014 12:04 PM
Visuals that include original source materials make classroom experiences much more relevant to students. It allows the story of the events to be made more real whether it is the experiences of WWI, WW II, or Civil Rights.

Anne-Maree Johnson's curator insight,
July 29, 2014 6:44 PM
valuable tool for teaching of history. A series of infographics, timelines and a referenced blog which give valuable visual insight into key events from the last century.
Beth Dichter's insight:
A collection of infographics and interactives that the NY Times published during 2012. Learn more about the Olympics, the 512 Paths to the White House, Hurricane Sandy’s Destruction in NY City and the region, Watching Syria’s War, 117 Years of Drought in theUSand more. Each one also provides a back story as well as information on how they were created.
Most visualizations end up as passing follies that are significant in the short-term, but in the long-run they fade to the background with the rest of the noise.
|
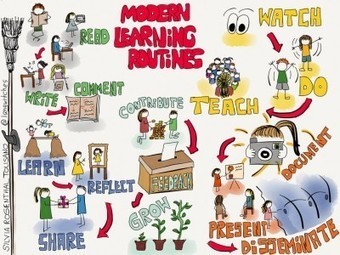
I have been a fan of Visible Thinking Routines which were developed by Project Zero from Havard, for a while now. I have used these routines with students, as blogging routines and in professional...
Beth Dichter's insight:
Silvia Tolisano shares updated visual thinking routines for: 1. Read > Write> Comment

Vanessa Camilleri's curator insight,
January 27, 2015 6:09 AM
A really wonderful representation of what being digital in this era is all about - learning in the digital era, is more of a contribution rather than a passive absorption of online information. 
veroco's curator insight,
February 10, 2015 12:42 PM
Nice vision : the "modern learning" routines => Read - Comment - Write / Watch - Do - Teach / Contribute - Feedback - Grow... 
Dr. Deborah Brennan's curator insight,
April 2, 2015 9:34 AM
These thinking routines can help teachers move toward teaching processes for learning rather than content alone. In the era of ever increasing knowledge, we need to help students learn how to learn.
That being said, these routines can also be used as a model for teachers by using them as options for professional development,
In our final post of Infographics Week, a history teacher tells how she used the Gulf oil spill to have students create infographics about the worst disasters in American history.
Beth Dichter's insight:
Have you thought about having students create infographics and held back because you were not sure how to go about doing this type of project? This post provides an in-depth look at one teacher does this type of project. A step-by-step list of what to do is included as well as the three essential questions that students were to address. Although designed for a high school class the step-by-step directions are easy to modify to meet the needs of your students. This was one of a series of posts published by the NY Times. At the end of the post there are links to four additional posts in this series on Teaching With Infographics: Places to Start; Social Studies, History, Economics; Science and Health; and Language Arts, Fine Arts, and Entertainment.

Nalya Ovshieva's curator insight,
September 29, 2013 3:14 AM
Infographics is a new kind of visual literacy. They are a kind of visual summary of information that would take a reader hours to process
David Baker's curator insight,
September 29, 2013 6:40 PM
This was a great project for our teachers last year. We are posting their info graphics outside out Office of Professional Development. 
Gayle Kakac's curator insight,
September 30, 2013 8:10 PM
Been loving infographics and looking for a good way to incorporate these. Hoping for an app that would make them easily. We'll see what this has to say...

"2012 has been a great year for all kinds of data visualizations. Data owners are realizing that the best way to communicate the insights buried in their data is by visualizing it. This means there have been tons of great static infographics, motion graphics, and interactive visualizations created this year. We did a roundup of some of the best from each category."
Beth Dichter's insight:
Are you looking for some great infographics/visualizations? If so, check out this post from Visual.ly that provides 20 great infographics of 2012, 20 great motion graphics of 2012 and 20 great interactive visualizations of 2012. Infographics and visualizations are great tools to use with students. Here is a list of a few of what you may find when you click through to the post: Curiosity's Landing on Mars (The Seven Minutes of Terror), a map of Hurricanes since 1851, Measuring the Universe, and the History of Manifest Destiny.
|


Nice info graphic for Blended Model Design and think through. Just add toolsets , curated content and PD