

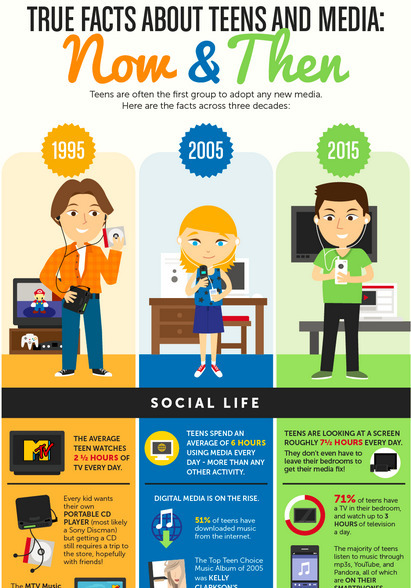

The meteoric rise in technology over the past three decades has completely changed the relationship between teens and media. Teens are often the first group to adopt a new technology.
Get Started for FREE
Sign up with Facebook Sign up with X
I don't have a Facebook or a X account


 Your new post is loading...
 Your new post is loading...
Your new post is loading...
The meteoric rise in technology over the past three decades has completely changed the relationship between teens and media. Teens are often the first group to adopt a new technology. 
No comment yet.
Sign up to comment
Did you know most students lose two months of knowledge in the summer? Find more statistics and how to promote summer learning in our guide.
Beth Dichter's insight:
The summer reading slump...as teachers we know that learners will lose skills if they do not use them during the summer. This article (which includes a lengthy infographic) shares statistics about what may happen over one summer (and also shares long- term consequences). Did you know that a learner at the end of Grade 6 whom has experienced summer learning loss over the years may be 2 years behind their peers? Or that 2.6 months of math skills are lost over the summer? Many schools are starting to prepare summer packets with the hope that learners will complete them over the summer. You may find that information in this infographic is worth sharing with parents. They may not be aware of the consequences of how much summer learning loss may impact their child.
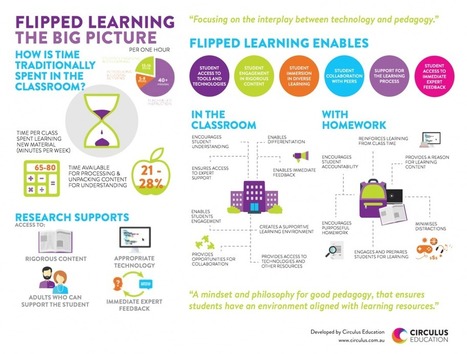
As we progress rapidly into the middle of the second decade of the 21st century, questions continue to be raised about how education addresses the ever ..
Beth Dichter's insight:
This post includes the inforgraphic (shown above) as well as additional information on pros and cons of flipping a class. The sections in the post are: * Flipped Learning for a Flipped World * Flipping the Numbers * Flipping to Engage Active Learning * Flipping from Passive to Active * In a Nutshell You may find new ideas in this post that will allow your learners to be be more engaged

Elizabeth Roman's curator insight,
April 29, 2015 8:44 PM
Infografía sobre el aprendizaje invertido: ¿Qué apoyo se necesita? ¿Qué se hace dentro y qué se hace fuera del aula?

You may be surprised by how much your emotional intelligence affects your career. If you’re getting your online MBA degree to develop your managerial and
Beth Dichter's insight:
Emotional IQ is a skill that is often mentioned as a key skill for the 21st century. This infographic shares information on emotional intelligence and is divided into a number of sections. * What is emotional intelligence (EI)? * Does higher EI mean improved job performance? * Why do employers value EI over IQ? * How EI affects your image? * Take stock of your EI. * Improve your emotional intelligence to improve your life Although this infographic is geared to students in college there is information that you may find to share with students across many grade levels. Emotional intelligence plays a role in our classrooms and providing learners with more skills in this area may improve their ability to more actively participate and be engaged.

" Nowadays, it's less about putting pen to paper and more about turning on your laptop. But are we losing about by letting the art of penmanship die?"
Beth Dichter's insight:
Cursive writing? Should we teach it or not? Many states are still requiring cursive writing be taught, but it is not part of the Common Core. This infographic provides information about why it is important that students learn cursive.

Bart van Maanen's curator insight,
February 21, 2015 10:17 AM
Uit onderzoek is gebleken dat leerlingen lesstof beter opnemen als ze handgeschreven notities maken. Gewoon leren schrijven en het ontwikkelen van je handschrift blijft dus van groot belang.
I have discussed educators as model learners before: The educator's role has or should change in this age of information abundance or Education 2.0-3.0. The educator's role has always been to model...
Beth Dichter's insight:
Has your role as a teacher shifted? Do you model being a learner with your learners? This post by Jackie Gerstein shares why it is important that the educator "needs to understand and be able to articulate and demonstrate the process of learning, him or herself." How can you go about doing this. Gerstein recommends that "educators pick something new to learn and practice doing the following: (below quoted from the post)
Gerstein then discusses each of these five steps/procedures/strategies, providing links to additional resources as well as one additional visual as well as a video that looks at how the learning process is iterative (and may provide you with an idea you would like to do with your class).

Lisa Norris's curator insight,
February 16, 2015 2:12 PM
If we want to build expert learners...we need to take the time to model this ourselves. 
SMARTERTEACHER's curator insight,
February 19, 2015 11:34 AM
The "Sage on the Stage" model must give way to the "Guide on the Side". Concurrently the teacher must model the learners mentality of facilitator of learning.
I have been a fan of Visible Thinking Routines which were developed by Project Zero from Havard, for a while now. I have used these routines with students, as blogging routines and in professional...
Beth Dichter's insight:
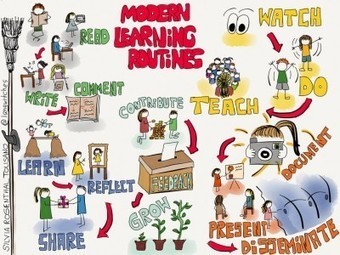
Silvia Tolisano shares updated visual thinking routines for: 1. Read > Write> Comment

Vanessa Camilleri's curator insight,
January 27, 2015 6:09 AM
A really wonderful representation of what being digital in this era is all about - learning in the digital era, is more of a contribution rather than a passive absorption of online information. 
veroco's curator insight,
February 10, 2015 12:42 PM
Nice vision : the "modern learning" routines => Read - Comment - Write / Watch - Do - Teach / Contribute - Feedback - Grow... 
Dr. Deborah Brennan's curator insight,
April 2, 2015 9:34 AM
These thinking routines can help teachers move toward teaching processes for learning rather than content alone. In the era of ever increasing knowledge, we need to help students learn how to learn.
That being said, these routines can also be used as a model for teachers by using them as options for professional development,
"To fly a kite you need a hearty breeze and lots of space. In a whimsical sense, humans are a lot like kites! Play gives both kids and adults the freedom and momentum to truly soar. For kids, play is a natural state that sparks learning, nurtures confidence, and builds communication skills. For adults, play provides a haven from the daily grind, inviting fresh ideas and spontaneity. For everyone, play is an ideal way to find ourselves and be ourselves! This infographic is a celebration of why play matters, gathering quotes and facts from advocates who believe in the power of play."
Beth Dichter's insight:
Do you know that when children engage in play they are also problem solving, testing out ideas, asking questions, building muscle and bone strength and much more? This infographic provides 34 reasons why play is important and includes the resources used. As many schools continue to decrease play time and focus on teaching core subjects this may remind us that time to play is critical.
"One of the greatest misconceptions in education today is that certain teachers have a higher natural aptitude in technology than others. This inspirationalgraphic sets out to disprove that notion and remind the audience that external skills are only a function of the internal dispositions that allowed them to grow."
Beth Dichter's insight:
Habits of mind are not only for students but also for teachers. This infographic provides 16 habits of mind that teachers may want to cultivate. What are your thoughts on this?
SMARTERTEACHER's curator insight,
February 1, 2015 11:23 AM
The simplicity of these statements make this seem so easy, but for many teachers these concepts are difficult and scary. The transition to student focus is a difficult one for many who still believe they are the keeper of the knowledge.
There's a science behind why your workouts boost your happiness. Learn how to optimize your fitness routine for even more joy.
Beth Dichter's insight:
This infographic shares the science behind exercise. Learn how to optimize your workout for maximum happiness, how to have more fun with less work, motivational tips and more. As teachers we often work long days and find it tough to get in our exercise, but if we can find the time we may find ourselves in a better place in the classroom.
To ensure learners get the most of your written eLearning content make your text as easy as possible to consume. These readability guidelines will help you out.
Beth Dichter's insight:
Do you know the best ways to design an eLearning course? SH!FT provides excellent resources and this post discusses readability. Learn more about: * What makes people want to read * The best fonts to use (think easy to read) * How to design eLearning for readability, which includes - Strategies to improve readability which includes five recommendations You will also find an infographic that shares this information.

Mike Clare's curator insight,
January 6, 2015 10:08 AM
This may be simple but do we always follow the advice given? I know I am gulity.
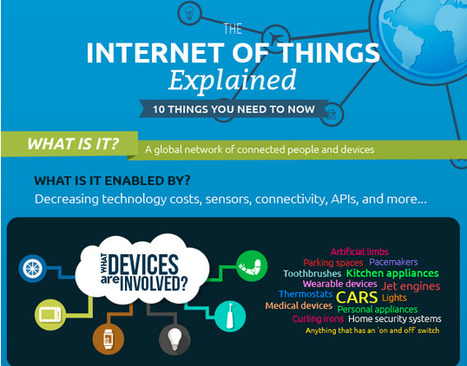
A few months ago I wrote a post called, A Simple Explanation Of The Internet Of Things where I tried to provide some clarity around what this new connected world means for all of us. In the article I mentioned some of the driving forces behind this. "Broadband Internet is become more [...]
Beth Dichter's insight:
Do you know what "the Internet of Things" means? This article and infographic from Forbes explains what this new interconnected world means and how this new interconnected world may impact our future. A portion of the infographic is shown in the image above. Additional information is available in the article as well as a link to a previous article published by the author, A Simple Explanation of the Internet of Things.
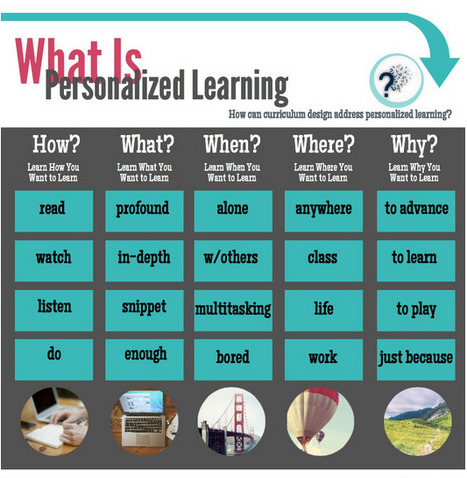
Some of the things we think about when designing personalized learning curriculum. What else do you think about? ~Mia
Beth Dichter's insight:
This infographic, byt Mia MacMeekin, looks at personalized learning and the three areas below. In each area the question is also "How can curriculum design address personalized learning?" What are the three areas? * What is personalized learning * How to personalize learning * Examples of personalized learning In each of these areas she also looks at the How, What, When, Where, and Why, providing key words or phrases that help you dig a little deeper into the subject. Mia MacMeekin has provided an infographic that you could share with others in your building. Today we are asked to personalize curriculum, but support is not always available. This visual will help you better understand some key concepts, and provide you with ideas on how you might move forward.

Andrew Chiu's curator insight,
December 5, 2014 12:11 AM
A matrix to help consider and design learning resources for more personalised learning. |
Beth Dichter's insight:
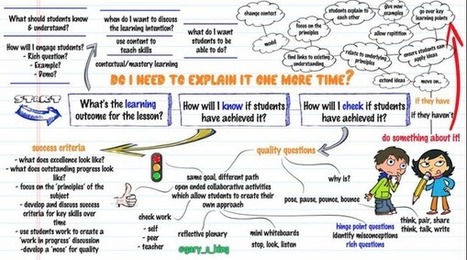
Take a look at this visual that describes the learning progression. It looks at three questions as the starting point: * What's the learning outcome for the lesson? * How will I know if students have achieved it? * How will I check if students have achieved it? A variety of ideas are shared for each of these questions...short and sweet, and great for visual learners.

Ra's curator insight,
June 18, 2015 6:16 AM
Great graphic for teachers to identify the strength of their learning intentions and outcomes.
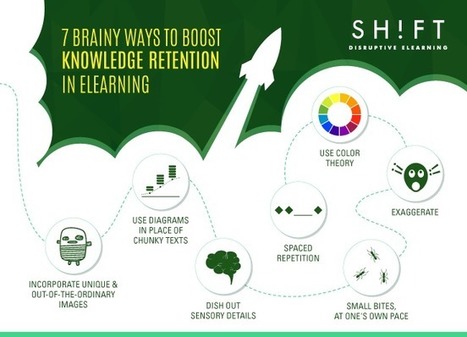
As instructional designers, you have to create courses that are easy to remember and difficult to forget. Here's how:
Beth Dichter's insight:
When we think of ways to boost knowledge retention in our learners, what works for students that are online also works for students in face2face classes. This post from SH!FT provides seven ways to help student retain knowledge. The visual above illustrates the concepts. The post provides additional information as well as links to #1 - When possible, use diagrams. Many people are visual learners. Consider using graphic organizers to provide "holistic views, expressing relationships, and identifying contrasting data." #2 - Incorporate unique and out-of-the ordinary images. Why? Images stay with us longer, and the more unique, the longer they tend to stay with us. #3 - Dish out sensory details. The more details that engage the learner the better. #4 - Use color therapy. Color works on many levels. Color can be used to organize, to grab our attention, and it can impact our mood. The last 3 suggestions are below...but you will need to click through to the post to learn more about each. #5 - Exaggerate. #6 - Small bites, at one's own pace. #7 - Spaced repetition.
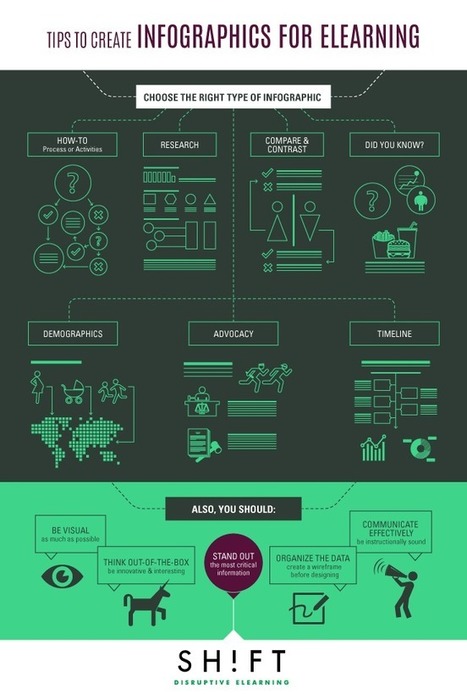
"But before you blindly jump on the infographics bandwagon and splatter your course with these visuals, make sure that you stock up on information about how they work and when to use them. Badly-designed infographics or placing them out of context can increase the cognitive load of a course. So here's the lowdown on infographics."
Beth Dichter's insight:
Infographics seem to be everywhere today, and educators are taking note and using them with students. This post provides information on the use of infographics for elearning, but the same concepts apply to face2face learning. The post is divided three sections that include: * When to use infographics * When NOT to use infographics * 6 tips to create effective and stunning infographics Additional resources are included in the post. If you are designing or revising a course and have not made use of infographics that post may provide you with ideas on how to best incorporate this form of visual learning into your curriculum. And if you currently use infographics check it out to learn more.

jane fullerton's curator insight,
March 29, 2015 10:26 AM
Awesome resource for a quick how to tutorial on infographics!
The Theory of Action Infographic by Carol Ehrlich …
Beth Dichter's insight:
This infographic is one resource found at this site, which also provides a detailed planning guide for Deeper Learning. Click through to the site and you will find a section on: * The DL Learning Guide which provides a series of exercises and a set of resources that demonstrate how you can create conditions necessary for Deeper Learning. * The User Guide an overview and framework. You will also find a Table of Contents. * You can access each phase from this section or you can move to the section called DL Phases. Phase 1 helps you Establish a Vision for Students. Phase 2 focuses on Understanding and Assessing the Conditions for Deeper Learning. Phase 3 guides you on Planning for Deeper Learning. Phase 4 is on Monitoring Your Plan for Deeper Learning. If your district or school is considering Deeper Learning this is a great resource to share, or to create a focus group to explore the concept and decide if it is the right time for your building.
Another visual I use with students: inquiry approaches to learning - again, great to promote 'soft skills' #sunchat pic.twitter.com/NhnwNMeehv
Beth Dichter's insight:
This visual on Inquiry Based Learning provides four questions in four areas: * Pose real and valid questions * Find the resources * Interpret the information * Report your findings If you provide opportunities for learners to use inquiry based approaches this visual may be helpful for students to have as they work through the process.
![15 Ways to Beat Procrastination [Infographic] | Eclectic Technology | Scoop.it](https://img.scoop.it/V_0yRgNYaZ3673C8kZ5SRjl72eJkfbmt4t8yenImKBVvK0kTmF0xjctABnaLJIm9)
"Procrastination is definitely not our friend. It makes us randomly search the web, watch funny youtube videos or constantly check twitter stream instead of doing things that matter. It kills our time and leads to failure. Now it's time to beat it! Here are 15 efficient techniques to get rid of procrastination and be more productive!"
Beth Dichter's insight:
Do you procrastinate? Do some of your students procrastinate? If so, this infographic may be one you want to share. It provides 15 techniques to help you beat procrastination. Two of the techniques are listed below. Each technique includes a short description plus a how and a why. To view the other 13 click through to the post. * Know Yourself How - Understand how procrastination affects your life Think about the habits that often cause it Why - Insight prevents you from feeling inadequate Helps you understand the causes of procrastination * Commit to assignments How - List tasks that you're confident you will complete Make a point of crossing each task off Why - Rebuilds faith in your own abilities Commits to making good on promises This post is geared to students in high school and college, yet you will find that many of the techniques could be shared with students in elementary and middle school.
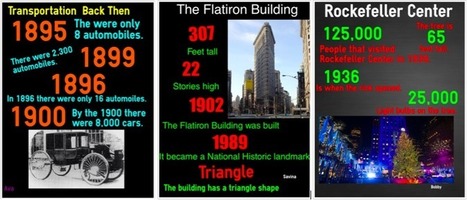
"For the past four years, we’ve been using infographics with our students at different grade levels. This year, our second graders were studying New York City to make comparisons between its historical past at the turn of the last century with today. Instead of the typical presentation poster, they made infographics using the Easelly app."
Beth Dichter's insight:
Can 2nd graders create infographics? Based on this post from ASIDE the answer would be yes! The students were able to Easel.ly and create 8 infographics that show their understanding of New York City at the turn of the century and today. Consider trying a similar project with students in your classroom (and make sure to learn to use Easel.ly before you introduce it to your students!).
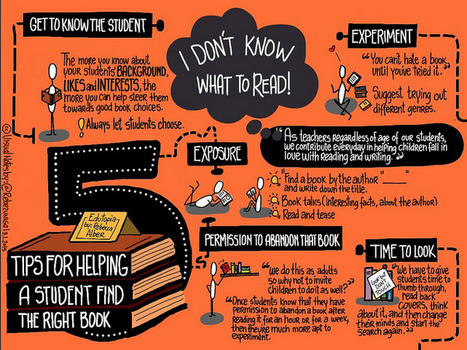
Research shows that children want assistance with finding a reading book. While your students search the stacks, here's some helpful tips for teachers.
Beth Dichter's insight:
Here are five great tips for helping students find books - a great find for librarians and for teachers in elementary school. The short hand version of the tips is below and additional information is located in the post.. 1. Get to know the student 2. Experiment 3. Exposure 4. Permission to abandon the book 5. Time to look. The visual above is not found on the site, but is found on Edutopia's Facebook page and also on Flickr.
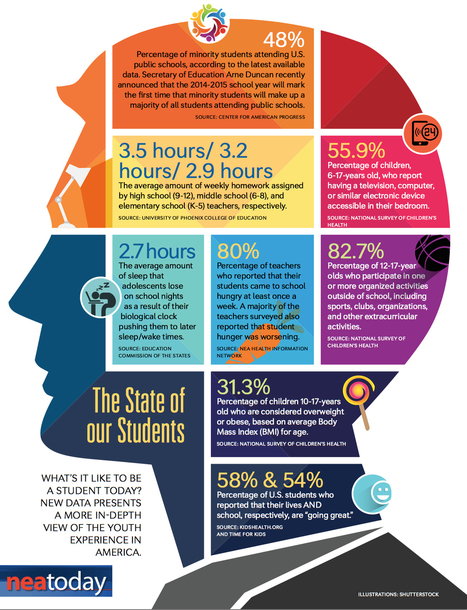
Beth Dichter's insight:
This is a fairly recent (~2 months old) view of a student today. * Did you know that Secretary of State Arne Duncan has said that the majority of students will be minority students this school year? * Did you know that the amount of homework assigned weekly be teachers varies from 2.9 hours in grades K-5 to 3.2 in grades 6-8 and 3.9 in grades 9 - 12? Additional information in this infographic looks at the percentage of students engaged in after school activities; the percentage of students with a television, computer or other electronic device in their bedroom; the average hours of sleep lost by adolescents (based on their biological clock; percentage of overweight students (ages 10 - 17) and more.
Beth Dichter's insight:
Last year I used fast foods as a way to teach students graphing (and nutrition). When surveying students as to their favorite fast food restaurants McDonald's was often at the top. This infographic provides a great deal of information that may be new to students. This infographic shows: * Just how big McDonald's is (and the number may surprise you) * The one location where the Golden Arches are not golden * Where McDonald's are located (a world map with percentages of McDonald's based on area) * The one fast food restaurant that has more locations that McDonald's * The number of employees worldwide (as well as the number of hamburgers and customers served) And much more. You can have fun with maps that look at fast food locations across the US as a tool for students to learn how to interpret visualizations as well as do some calculations. One source you might check out is listed below. * A map of all the McDonald's in the U.S. (published in 2009 and updated in 2010 at http://www.datapointed.net/2010/09/distance-to-nearest-mcdonalds-sept-2010/
Beth Dichter's insight:
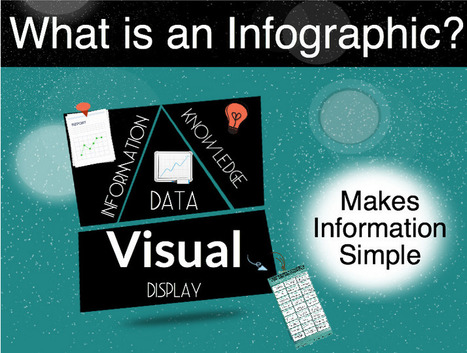
If you have not used infographics with your class this infographic may be what moves you try them with your students. Research tells us that many of our students are visual learners, and great infographics provide information that is accessible. Mia MacMeekin provides an infographic that looks at four areas. * What is an infographic? * Why an infographic? * What are the benefits? * Can it change education The joy of infographics is that students can also create them. Take some time to explore this post, and consider using them in your classroom.
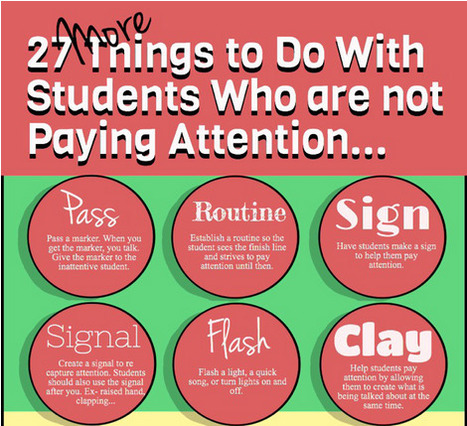
Beth Dichter's insight:
Check out this new infographic from Mia MacMeekin that provides 27 tips on ways you might work with students who are not paying attention. Some of these suggestions may be new to you. Consider sharing this with teachers at your school and beyond!
|


![Things You Never Knew About McDonald's [infographic] | Eclectic Technology | Scoop.it](https://img.scoop.it/LEkQV2Q9psu2DAga-sKHITl72eJkfbmt4t8yenImKBVvK0kTmF0xjctABnaLJIm9)


How has teenagers use of social media changed over the past 20 years? Learn more from this infographic which looks at the years 1995, 2005 and 2015. Teens are often the first to adopt new technology, but their patterns have changed over the years. The infographic shares information on social life and social media over the three decades and also looks at how teens are using social media today, specifically discussing Facebook, Instagram, Twitter, Snapchat, tumblr, and YikYak.
This post may be one to share with other faculty as well as parents, and could lead to an interesting discussion with teens in your classroom.