


Buckle up and ride a rocket through our interactive view of the Solar System to explore our cosmic neighbourhood
Get Started for FREE
Sign up with Facebook Sign up with X
I don't have a Facebook or a X account


 Your new post is loading...
 Your new post is loading...
Your new post is loading...
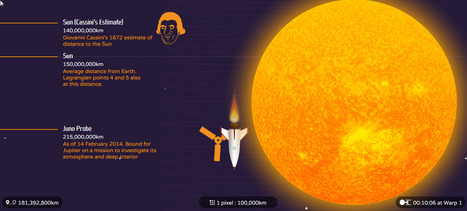
Buckle up and ride a rocket through our interactive view of the Solar System to explore our cosmic neighbourhood
Beth Dichter's insight:
BBC has released another great interactive infographic which allows you to travel through space and learn just how big it is. You begin your trip with blasting off earth and at 6.1 km you will pass the start of the high cloud layer....continue through the stratosphere to the mesosphere to the thermosphere and beyond. After a very long journey you will reach the edges of our solar system, where you will be told "It would take you about 23 million years of continuous scrolling on this scale to get to the farthest regions of the observable universe..." The distance of our solar system is vast, and this interactive may help our learners begin to understand just how vast it is. 
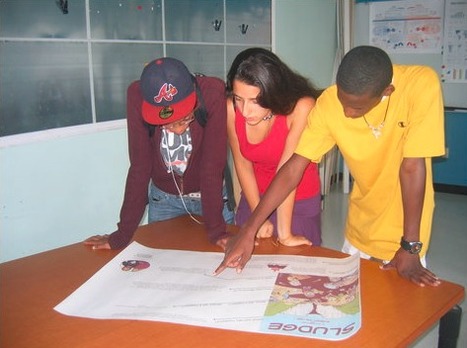
In our final post of Infographics Week, a history teacher tells how she used the Gulf oil spill to have students create infographics about the worst disasters in American history.
Beth Dichter's insight:
Have you thought about having students create infographics and held back because you were not sure how to go about doing this type of project? This post provides an in-depth look at one teacher does this type of project. A step-by-step list of what to do is included as well as the three essential questions that students were to address. Although designed for a high school class the step-by-step directions are easy to modify to meet the needs of your students. This was one of a series of posts published by the NY Times. At the end of the post there are links to four additional posts in this series on Teaching With Infographics: Places to Start; Social Studies, History, Economics; Science and Health; and Language Arts, Fine Arts, and Entertainment.

Nalya Ovshieva's curator insight,
September 29, 2013 3:14 AM
Infographics is a new kind of visual literacy. They are a kind of visual summary of information that would take a reader hours to process

David Baker's curator insight,
September 29, 2013 6:40 PM
This was a great project for our teachers last year. We are posting their info graphics outside out Office of Professional Development. 
Gayle Kakac's curator insight,
September 30, 2013 8:10 PM
Been loving infographics and looking for a good way to incorporate these. Hoping for an app that would make them easily. We'll see what this has to say...
Who knew? Infogr.am, a tool that allows you to create infographics, now allows you to include videos in your infographics...with the caveat they must come from YouTube or Vimeo. For more information check out this post from Richard Byrne!
|
"This past week I taught a few classes on infographics and decided to update the page by adding a section called "Teaching With Infographics". It is important for your students to make sure that they evaluate any infographics they are using, by making sure the author/creator has cited their references. Misinformation on the web exists. Have students read these tips to make a better infographic."
Beth Dichter's insight:
The Media Specialist has recently updated her information on teaching with infographics. This post provides many great resources including a post on tips to make better infographics, an in-depth video on teaching with infographics, a series of videos that detail how to use Piktochart to create infographics, and many other resources. If you are considering having students create infographics check out this post for resources.

The Rice Process's curator insight,
February 9, 2014 10:35 AM
Very helpful and great tips to follow. 
Claudia Estrada's curator insight,
February 23, 2014 2:56 PM
Working with info graphics has become an important skill now a days because new generation reads better images with less text. Helping students to become good users of it is developing 21st. century learners.
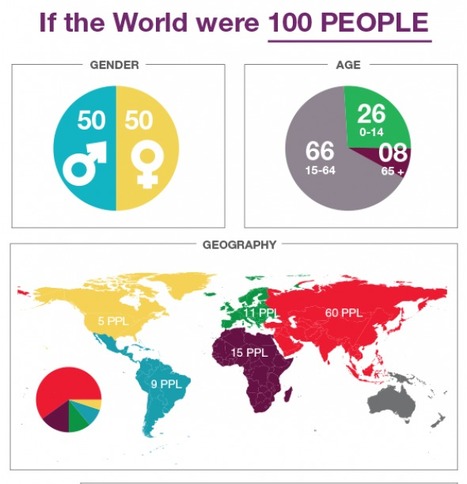
"A couple of days ago I read an article by Ryann Warlickabout an infographic displaying the world as 100 people. I've seen infographics like this before and you probably have too. Ryann used the infographic as the basis for helping students think about identifying people that they can help. I encourage you to read the short article."
Beth Dichter's insight:
Richard Byrne provides three infographics that look at how one might view the world as 100 people. Why choose three infographics? We have many different learners in our classrooms and what works for one may not work for another...thus three infographics. You might use them to launch a discussion on how we perceive information or use them when teaching students about infographics and have them consider which they find best illustrates the information and discuss why it does.
|


Thx Beth Dichter